


版权说明:本文档由用户提供并上传,收益归属内容提供方,若内容存在侵权,请进行举报或认领
文档简介
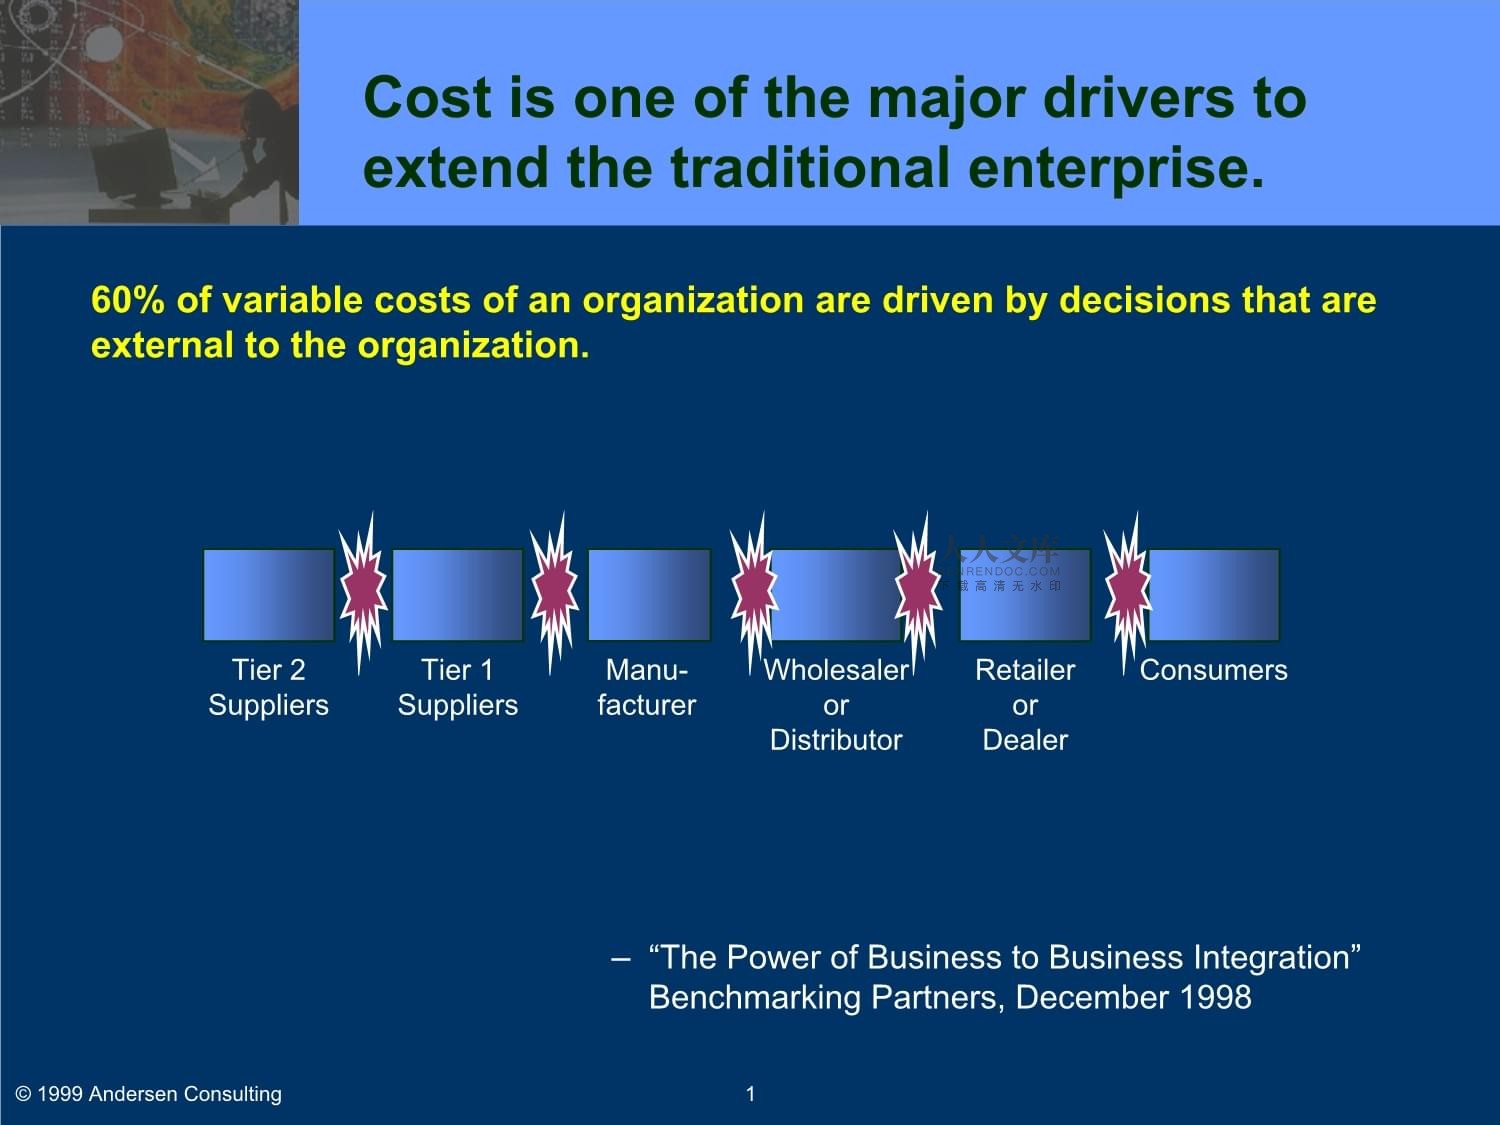
TheValuePropositionofSupplyChainManagement0©1999AndersenConsultingTheValuePropositionof0©199Manu-facturerTier2SuppliersTier1SuppliersWholesalerorDistributorRetailerorDealerConsumers“ThePowerofBusinesstoBusinessIntegration”
BenchmarkingPartners,December1998Costisoneofthemajordriverstoextendthetraditionalenterprise.60%ofvariablecostsofanorganizationaredrivenbydecisionsthatareexternaltotheorganization.1©1999AndersenConsultingManu-Tier2Tier1WholesalerRetLogisticsexpenseincludes:FinishedGoodsTransportationWarehousingOrderEntry/CustomerServiceAdministrationInventoryCarryingCost@18%—NorthAmericanAnnualTotalLogisticsCostChangeinPercentage—Source: CouncilofLogisticsManagement1997AnnualConferenceProceedings,LogisticsCostsandCustomerServiceLevels(HerbertW.Davis&WilliamH.Drumm)Thepasteffortshavenotbeenwithoutconsiderablerewards.-50%-30%-10%10%30%50%838485868788899091929394959697%ofSales$/CWT$/CWT=Dollarsperhundredweight.2©1999AndersenConsultingLogisticsexpense—NorthAmeri
BestinClassAverage12Source:LogisticsManagement,April1997Yet,supplychaincostreductionstillrepresentsasignificantbusinessopportunity…...SupplyChainSpendasaPercentageofRevenues$34$37$34$20$15$8$4$10$162SizeofGapinBillions3©1999AndersenConsulting BestinClassVALUETHEORYholdsthattoincreasethevalueofacompany,youmustincreasecashearningsinexcessofitsfullcostofcapitalinasustainablefashionThesupplychainmustcontinuetodriveshareholdervalue.4©1999AndersenConsultingVALUETHEORYThesupplychainmRevenueCostsWorkingCapitalFixedCapital—ImpactofSCM—Greatercustomerservice(i.e.,highermarketshare,greatergrossmargins)LowerrawmaterialsandfinishedgoodsinventoryShorter“order-to-cash”cyclesShareholderValueProfitabilityInvestedCapitalSCMhascontributedtoincreasedshareholdervaluebyimpactingtraditionalvaluelevers.Fewerphysicalassets(i.e.,trucks,warehouses,materialhandlingequipment,etc.)Lowercostofgoodssold,transportation,warehousing,materialhandlinganddistributionmanagementcosts5©1999AndersenConsultingRevenueCostsWorkingCapitalFixCostsAssetsCustomer
ServiceStrategicandFinancialImpactTheimprovementofSCMhassignificantstrategicandfinancialimpactsonbottomlineactivities.ShareholderValueCreationCustomerServiceLevelIncreaseSupplyChainVariabilityReductionInventoryReductionCycle-timeCompressionFinancials/Metrics.ROA94%98%In-stockavailabilityLeadtimeAbilitytotailortospecific
customerneedsFixedPurchaseCostVariableManufacturingTrans/DistributionObsolescence/MarkdownAdministrative/TransactionManufacturingDistributionCentersInventory6©1999AndersenConsultingCostsAssetsCustomer
ServiceStrBestinClasscompaniesenjoysignificantadvantageovertheircompetitors.TotalSupply-ChainMgmt.Cost“Foracompanywithannualsalesof$2billionanda60%costofsales,thedifferencebetweenbeingatthemedianintermsofperformanceandbeinginthetop20%is$176millioninworkingcapital.”7.06.30%2%4%6%8%10%12%14%19961997RevenueBestMedian37318702040608010012019961997CalendarDaysCash-to-CashCycleTime13.111.61051997PRTMStudy7©1999AndersenConsultingBestinClasscompaniesenjoy35347866010203040506070809010019961997DaysofSupply949471810%10%20%30%40%50%60%70%80%90%100%19961997TotalDaysofSupplyOn-TimeDeliveryPerformanceBestMedianU.S.Dept.ofCommerceestimatesthatmanufacturershavecutinventoriesby9%inthe1990’ssavingabout$82Billion[Fortune3/3/97].BestinClasscompaniesenjoysignificantadvantageovertheircompetitors.1997PRTMStudy8©1999AndersenConsulting353478660102030405060708090100Forperiod1988-1996;SourceStrategicSupplyChainAlignment,1998500%AboveAverage3000%AboveAverage250%AboveAverageIndustryleadershavedemonstratedthesignificantvaluethatsuccessfulsupplychainscancreate.PointofSaleDataandFlowThroughDistribution“RetailDirect”StrategyInvestmentinDistributionNetwork9©1999AndersenConsultingForperiod1988-1996;SourceSInventoryTurns50timesperyearThe1997AndersenConsultingGlobalElectronicsStudy(GES)showedthattotalinventoryintheU.S.technologyindustrysupplychainwasaround$0.5-1.5trillionandturnedlessthan10timesperyear.SupplyChainOpportunitiesforEHTIndustryStill,therearepotentialInventoryReductionOpportunities10-30%Inter-enterprisePostponement10-30%Intra-enterprisePostponement40-65%Direct-to-CustomerSales10-25%Joint(Collaborative)PlanningSource:AC-Stanford-Northwestern’sCDDNStudy,also1996U.S.Censusdata10©1999AndersenConsultingInventoryTurnsThe1997Ander-Inter-CompanySupplyChainPractices-AlltheTimeNotatAllLowerHigherLowerHigherLowerHigherLowerHigherLowerHigherLowerHigherLowerHigherSupplierOwnedOrManagedInventoryThirdPartyLogistics(Warehousing)ThirdPartyLogistics(Transportation)ThirdPartyLogistics(InformationManagement)ElectronicInformationSystemstoManageChannelFillRatesandReplenishmentCustomerAccesstoInternalSystemstoTrackOrderConfiguretoOrderStrategy543210LowerPerformersHigherPerformersSource:ManufacturingManagerResponses(4/2/97data)ThematerialcontainedinthispresentationisconfidentialandproprietarytoAndersenConsulting.4C-15Higherperformingglobalelectronicscompaniesintegratemoreextensivelyacrossthesupplychain.11©1999AndersenConsulting-Inter-CompanySupplyChainPSubstantialvaluecreationhasbeenidentifiedforcomputersupplychain.AndersenConsulting’sCDDNStudy-BenefitsSummary-SuppliersSemic.StorageAssemblersDistributorsRetailersInv.MarginValue-- -- 10%-70% 10%-100% ---- -- .7%-4.7% .5%-4.9% ---- -- $70-$470M $10-$102M --Inv.MarginValueInv.MarginValue-- -- 10%-70% 10%-100% --5.3% 2.0% 2.2% -- --$69M $18M $145M -- --Compressed
SupplyChainCollaborativePlanningDesignforResponsiveness10%-25%10%-25%10%-25%10%-25%10%-25%.6%-1.4%.6%-.7%.7%-1.8%.5%-1.2%.7%-1.6%$9-$23M$4-$9M$70-$181M$10-$26M$26-$64M12©1999AndersenConsultingSubstantialvaluecreationhasSupplychainbreakthroughhasrealizedinsignificantbenefits.TypicalLevelsofSupplyChainBenefits:Benchmark Improvement
Deliveryperformance 16-28%Inventoryreduction 25-60%Fulfilmentcycletime 30-50%Forecastaccuracy 25-80%Overallproductivity 10-16%LowerS.C.costs 25-50%Improvedcapacity 10-20%Source:AMR&PRTMBreakthroughareas:IntegratedDemandandSupplyPlanningNewbusinessmodelsandportfoliosofbestrelationshipsStrategicSourcingandeProcurementeCustomerlinkedtoDemandChain13©1999AndersenConsultingSupplychainbreakthroughhasWhichshouldcomefirst?SCMorERP?CustomerValueSupplychainplanningERPGlobalfinancialsLowHighTickettoEntryLow-HangingFruitHardNuttoCrackNarcissisticTimetoProduceNetValueWarehousemgmt.ShortLongSource:
Gartner
Group,1998
SCM ERPROI(times) 5to15 1.5to2Payback in 2to3Period months yearsAchievinginternalefficienciesisimportant,however,theexternalintegrationcanmakethedifferencebetweenmarketleadershipandfailure.Highreturnsfromexternalintegrationcanbeachievedevenwheninternalintegrationisnotverysophisticated.Itisn’tnecessarytowaituntilyourinternalintegrationeffortsarecompletetobeginexternalintegrationinitiatives.(KenRoss,ExtricitySoftware,Inc.)14©1999AndersenConsultingWhichshouldcomefirst?SCMo供应链管理的价值15©1999AndersenConsulting供应链管理的价值15©1999AndersenCons制造商第二层供应商第一层供应商批发商或分销商零售商或经销商顾客“ThePowerofBusinesstoBusinessIntegration”
BenchmarkingPartners,December1998成本是扩展传统企业的主要推动力之一.机构的60%可变成本由机构对外的决策所支配16©1999AndersenConsulting制造商第二层第一层批发商零售商顾客“ThePowerof后勤开销包括:产成品运输仓库费定货手续/ 客户服务管理仓储成本
@18%—北美每年总的后勤成本变化百分比—Source: CouncilofLogisticsManagement1997AnnualConferenceProceedings,LogisticsCostsandCustomerServiceLevels(HerbertW.Davis&WilliamH.Drumm)过去的努力不是没有回报-50%-30%-10%10%30%50%838485868788899091929394959697%ofSales$/CWT$/CWT=Dollarsperhundredweight.17©1999AndersenConsulting后勤开销—北美每年总的后勤成本变化百分比—Source:
最好
平均12Source:LogisticsManagement,April1997然而,供应链成本降低仍存在巨大的商业机会...供应链消耗占销售收入的百分比$34$37$34$20$15$8$4$10$162SizeofGapinBillions18©1999AndersenConsulting 最好价值理论为了让企业增值,必须以能够持续经营的方式将收入提高到超过总成本供应链一定会推动股东的利益.19©1999AndersenConsulting价值理论供应链一定会推动股东的利益.19©1999And收入成本营运资本固定资本—SCM的影响—更强大的客户服务(如,更高的市场份额,更多的毛利)更低的原料及产成品的库存更短的“定单变现”周期股东价值收益性投资资本SCM通过对传统价值杠杆的影响,为增加股东的价值做出贡献更少的实物资产(如,卡车,仓库,原料处理设备,等)更低的商品销售、运输、仓储、材料处理及分销管理成本20©1999AndersenConsulting收入成本营运固定—SCM的影响—更强大的客户服务(如,更成本资产客户服务战略及财务的影响
SCM改善对有战略及财务具有巨大影响创造股东价值客户服务水平提高供应链变动性降低
库存减少周期压缩财务衡量ROA94%98%现货供应能力
交付周期根据客户特殊要求定制的能力固定采购成本可变制造成本运输/发行成本无形磨损费/减价管理/交易成本制造行业的资产分销中心库存21©1999AndersenConsulting成本资产客户战略及财务的影响SCM改善对有战略及财务具有最好的公司得益于巨大的竞争优势.总供应链管理成本“对于年销售收入为20亿及60%的销售成本的企业,中等层次的企业与前20%的企业之间的运营资本的差异为1.76亿美圆。7.06.30%2%4%6%8%10%12%14%19961997收入最好中等37318702040608010012019961997天数现金周转周期13.111.61051997PRTMStudy22©1999AndersenConsulting最好的公司得益于巨大的竞争优势.总供应链管理成本“对于年销售35347866010203040506070809010019961997供应天数949471810%10%20%30%40%50%60%70%80%90%100%19961997总供应天数按时供货最好中等美国商业部门估计,制造业在20世纪90年代降低了9%的库存,节省了820亿美圆[财富3/3/97].最好的公司得益于巨大的竞争优势.1997PRTMStudy23©1999AndersenConsulting353478660102030405060708090100Forperiod1988-1996;SourceStrategicSupplyChainAlignment,1998高于平均水平500%高于平均水平3000%高于平均水平250%行业巨头证明供应链的成功带来的巨大价值贯穿整个销售过程的销售信息及流程“直销策略”分销网络的投资24©1999AndersenConsultingForperiod1988-1996;SourceS库存周转率为50次/年1997安达信全球电子行业研究显示,美国科技企业供应链的总库存约为$0.5-1.5万亿,并且库存周转率低于10次/年对于高科技电子行业的供应链尽管如此,仍存在减少库存的潜力10-30%企业内部的延迟10-30%企业外部的延迟40-65%直销10-25%协同计划Source:AC-Stanford-Northwestern’sCDDNStudy,also1996U.S.Censusdata25©1999AndersenConsulting库存周转率为1997安达信全球电子行业研究显示,美国科技企业-企业内部供应链实践-总是根本不差好差好差好差好差好差好差好供应商拥有或管理库存第三方后勤(仓储)第三方后勤(运输)第三方后勤(信息管理)电子信息系统管理渠道供应与补充客户访问内部系统跟踪定单制订定货策略543210差好Source:ManufacturingManagerResponses(4/2/97data)ThematerialcontainedinthispresentationisconfidentialandproprietarytoAndersenConsulting.4C-15优秀的全球化电子公司广泛地整合供应链26©1999AndersenConsulting-企业内部供应链实践-总是根本不差好差好差好差好差好差好计算机行业的价值链创造了价值.AndersenConsulting’sCDDNStudy-受益情况-供应商Semic.Storage装配企业分销商零售商库存.利润价值-- -- 10%-70% 10%-100% ---- -- .7%-4.7% .5%-4.9% ---- -- $70-$470M $10-$102M --库存.利润价值库存.利润价值-- -- 10%-70% 10%-100% --5.3% 2.0% 2.2% -- --$69M $18M $145M -- --扁平化协同计划快速反应10%-25%10%-25%10%-25%10%-25%10%-25%.6%-1.4%.6%-.7%.7%-1.8%.5%-1.2%.7%-1.6%$9-$23M$4-$9M$70-$181M$10-$26M$26-$64M27©1999AndersenConsulting计算机行业的价值链创造了价值.AndersenConsul供应链的突飞猛进实现了巨大价值.供应链的典型收益:项目
改善
交货能力 16-28%库存减少 25-60%实现周期 30-50%预测的准确性 25-80%总生产率 10-16%降低供应链成本 25-50%能力提高 10-20%源自:AMR&PRTM成功的领域:集成的需求与供应计划新商业模型及最佳关系组合战略资源及电子采购、电子客户被需求链联系起来28©1999AndersenConsulting供应链的突飞猛进实现了巨大价值.供应链的典型收益:项目哪个先开始?SCM还是
ERP?客户价值供应链计划ERPGlobalfinancials低高TickettoEntryLow-HangingFruitHardNuttoCrackNarcissistic产生净值的时间仓库管理短长Source:
Gartner
Group,1998
SCM ERP投资回报率(倍) 5到15 1.5到2回报周期
数月 2到3年
内部效率的提高固然重要,但是,外部整合会影响到企业的成功与失败。即使内部整合不是很完善的时候,我们也可以从外部整合得到高额回报。没有必要等到内部整合完全结束才开始进行外部的整合.(KenRoss,ExtricitySoftware,Inc.)29©1999AndersenConsulting哪个先开始?SCM还是ERP?客户价值供应链计划ERPTheValuePropositionofSupplyChainManagement30©1999AndersenConsultingTheValuePropositionof0©199Manu-facturerTier2SuppliersTier1SuppliersWholesalerorDistributorRetailerorDealerConsumers“ThePowerofBusinesstoBusinessIntegration”
BenchmarkingPartners,December1998Costisoneofthemajordriverstoextendthetraditionalenterprise.60%ofvariablecostsofanorganizationaredrivenbydecisionsthatareexternaltotheorganization.31©1999AndersenConsultingManu-Tier2Tier1WholesalerRetLogisticsexpenseincludes:FinishedGoodsTransportationWarehousingOrderEntry/CustomerServiceAdministrationInventoryCarryingCost@18%—NorthAmericanAnnualTotalLogisticsCostChangeinPercentage—Source: CouncilofLogisticsManagement1997AnnualConferenceProceedings,LogisticsCostsandCustomerServiceLevels(HerbertW.Davis&WilliamH.Drumm)Thepasteffortshavenotbeenwithoutconsiderablerewards.-50%-30%-10%10%30%50%838485868788899091929394959697%ofSales$/CWT$/CWT=Dollarsperhundredweight.32©1999AndersenConsultingLogisticsexpense—NorthAmeri
BestinClassAverage12Source:LogisticsManagement,April1997Yet,supplychaincostreductionstillrepresentsasignificantbusinessopportunity…...SupplyChainSpendasaPercentageofRevenues$34$37$34$20$15$8$4$10$162SizeofGapinBillions33©1999AndersenConsulting BestinClassVALUETHEORYholdsthattoincreasethevalueofacompany,youmustincreasecashearningsinexcessofitsfullcostofcapitalinasustainablefashionThesupplychainmustcontinuetodriveshareholdervalue.34©1999AndersenConsultingVALUETHEORYThesupplychainmRevenueCostsWorkingCapitalFixedCapital—ImpactofSCM—Greatercustomerservice(i.e.,highermarketshare,greatergrossmargins)LowerrawmaterialsandfinishedgoodsinventoryShorter“order-to-cash”cyclesShareholderValueProfitabilityInvestedCapitalSCMhascontributedtoincreasedshareholdervaluebyimpactingtraditionalvaluelevers.Fewerphysicalassets(i.e.,trucks,warehouses,materialhandlingequipment,etc.)Lowercostofgoodssold,transportation,warehousing,materialhandlinganddistributionmanagementcosts35©1999AndersenConsultingRevenueCostsWorkingCapitalFixCostsAssetsCustomer
ServiceStrategicandFinancialImpactTheimprovementofSCMhassignificantstrategicandfinancialimpactsonbottomlineactivities.ShareholderValueCreationCustomerServiceLevelIncreaseSupplyChainVariabilityReductionInventoryReductionCycle-timeCompressionFinancials/Metrics.ROA94%98%In-stockavailabilityLeadtimeAbilitytotailortospecific
customerneedsFixedPurchaseCostVariableManufacturingTrans/DistributionObsolescence/MarkdownAdministrative/TransactionManufacturingDistributionCentersInventory36©1999AndersenConsultingCostsAssetsCustomer
ServiceStrBestinClasscompaniesenjoysignificantadvantageovertheircompetitors.TotalSupply-ChainMgmt.Cost“Foracompanywithannualsalesof$2billionanda60%costofsales,thedifferencebetweenbeingatthemedianintermsofperformanceandbeinginthetop20%is$176millioninworkingcapital.”7.06.30%2%4%6%8%10%12%14%19961997RevenueBestMedian37318702040608010012019961997CalendarDaysCash-to-CashCycleTime13.111.61051997PRTMStudy37©1999AndersenConsultingBestinClasscompaniesenjoy35347866010203040506070809010019961997DaysofSupply949471810%10%20%30%40%50%60%70%80%90%100%19961997TotalDaysofSupplyOn-TimeDeliveryPerformanceBestMedianU.S.Dept.ofCommerceestimatesthatmanufacturershavecutinventoriesby9%inthe1990’ssavingabout$82Billion[Fortune3/3/97].BestinClasscompaniesenjoysignificantadvantageovertheircompetitors.1997PRTMStudy38©1999AndersenConsulting353478660102030405060708090100Forperiod1988-1996;SourceStrategicSupplyChainAlignment,1998500%AboveAverage3000%AboveAverage250%AboveAverageIndustryleadershavedemonstratedthesignificantvaluethatsuccessfulsupplychainscancreate.PointofSaleDataandFlowThroughDistribution“RetailDirect”StrategyInvestmentinDistributionNetwork39©1999AndersenConsultingForperiod1988-1996;SourceSInventoryTurns50timesperyearThe1997AndersenConsultingGlobalElectronicsStudy(GES)showedthattotalinventoryintheU.S.technologyindustrysupplychainwasaround$0.5-1.5trillionandturnedlessthan10timesperyear.SupplyChainOpportunitiesforEHTIndustryStill,therearepotentialInventoryReductionOpportunities10-30%Inter-enterprisePostponement10-30%Intra-enterprisePostponement40-65%Direct-to-CustomerSales10-25%Joint(Collaborative)PlanningSource:AC-Stanford-Northwestern’sCDDNStudy,also1996U.S.Censusdata40©1999AndersenConsultingInventoryTurnsThe1997Ander-Inter-CompanySupplyChainPractices-AlltheTimeNotatAllLowerHigherLowerHigherLowerHigherLowerHigherLowerHigherLowerHigherLowerHigherSupplierOwnedOrManagedInventoryThirdPartyLogistics(Warehousing)ThirdPartyLogistics(Transportation)ThirdPartyLogistics(InformationManagement)ElectronicInformationSystemstoManageChannelFillRatesandReplenishmentCustomerAccesstoInternalSystemstoTrackOrderConfiguretoOrderStrategy543210LowerPerformersHigherPerformersSource:ManufacturingManagerResponses(4/2/97data)ThematerialcontainedinthispresentationisconfidentialandproprietarytoAndersenConsulting.4C-15Higherperformingglobalelectronicscompaniesintegratemoreextensivelyacrossthesupplychain.41©1999AndersenConsulting-Inter-CompanySupplyChainPSubstantialvaluecreationhasbeenidentifiedforcomputersupplychain.AndersenConsulting’sCDDNStudy-BenefitsSummary-SuppliersSemic.StorageAssemblersDistributorsRetailersInv.MarginValue-- -- 10%-70% 10%-100% ---- -- .7%-4.7% .5%-4.9% ---- -- $70-$470M $10-$102M --Inv.MarginValueInv.MarginValue-- -- 10%-70% 10%-100% --5.3% 2.0% 2.2% -- --$69M $18M $145M -- --Compressed
SupplyChainCollaborativePlanningDesignforResponsiveness10%-25%10%-25%10%-25%10%-25%10%-25%.6%-1.4%.6%-.7%.7%-1.8%.5%-1.2%.7%-1.6%$9-$23M$4-$9M$70-$181M$10-$26M$26-$64M42©1999AndersenConsultingSubstantialvaluecreationhasSupplychainbreakthroughhasrealizedinsignificantbenefits.TypicalLevelsofSupplyChainBenefits:Benchmark Improvement
Deliveryperformance 16-28%Inventoryreduction 25-60%Fulfilmentcycletime 30-50%Forecastaccuracy 25-80%Overallproductivity 10-16%LowerS.C.costs 25-50%Improvedcapacity 10-20%Source:AMR&PRTMBreakthroughareas:IntegratedDemandandSupplyPlanningNewbusinessmodelsandportfoliosofbestrelationshipsStrategicSourcingandeProcurementeCustomerlinkedtoDemandChain43©1999AndersenConsultingSupplychainbreakthroughhasWhichshouldcomefirst?SCMorERP?CustomerValueSupplychainplanningERPGlobalfinancialsLowHighTickettoEntryLow-HangingFruitHardNuttoCrackNarcissisticTimetoProduceNetValueWarehousemgmt.ShortLongSource:
Gartner
Group,1998
SCM ERPROI(times) 5to15 1.5to2Payback in 2to3Period months yearsAchievinginternalefficienciesisimportant,however,theexternalintegrationcanmakethedifferencebetweenmarketleadershipandfailure.Highreturnsfromexternalintegrationcanbeachievedevenwheninternalintegrationisnotverysophisticated.Itisn’tnecessarytowaituntilyourinternalintegrationeffortsarecompletetobeginexternalintegrationinitiatives.(KenRoss,ExtricitySoftware,Inc.)44©1999AndersenConsultingWhichshouldcomefirst?SCMo供应链管理的价值45©1999AndersenConsulting供应链管理的价值15©1999AndersenCons制造商第二层供应商第一层供应商批发商或分销商零售商或经销商顾客“ThePowerofBusinesstoBusinessIntegration”
BenchmarkingPartners,December1998成本是扩展传统企业的主要推动力之一.机构的60%可变成本由机构对外的决策所支配46©1999AndersenConsulting制造商第二层第一层批发商零售商顾客“ThePowerof后勤开销包括:产成品运输仓库费定货手续/ 客户服务管理仓储成本
@18%—北美每年总的后勤成本变化百分比—Source: CouncilofLogisticsManagement1997AnnualConferenceProceedings,LogisticsCostsandCustomerServiceLevels(HerbertW.Davis&WilliamH.Drumm)过去的努力不是没有回报-50%-30%-10%10%30%50%838485868788899091929394959697%ofSales$/CWT$/CWT=Dollarsperhundredweight.47©1999AndersenConsulting后勤开销—北美每年总的后勤成本变化百分比—Source:
最好
平均12Source:LogisticsManagement,April1997然而,供应链成本降低仍存在巨大的商业机会...供应链消耗占销售收入的百分比$34$37$34$20$15$8$4$10$162SizeofGapinBillions48©1999AndersenConsulting 最好价值理论为了让企业增值,必须以能够持续经营的方式将收入提高到超过总成本供应链一定会推动股东的利益.49©1999AndersenConsulting价值理论供应链一定会推动股东的利益.19©1999And收入成本营运资本固定资本—SCM的影响—更强大的客户服务(如,更高的市场份额,更多的毛利)更低的原料及产成品的库存更短的“定单变现”周期股东价值收益性投资资本SCM通过对传统价值杠杆的影响,为增加股东的价值做出贡献更少的实物资产(如,卡车,仓库,原料处理设备,等)更低的商品销售、运输、仓储、材料处理及分销管理成本50©1999AndersenConsulting收入成本营运固定—SCM的影响—更强大的客户服务(如,更成本资产客户服务战略及财务的影响
SCM改善对有战略及财务具有巨大影响创造股东价值客户服务水平提高供应链变动性降低
库存减少周期压缩财务衡量ROA94%98%现货供应能力
交付周期根据客户特殊要求定制的能力固定采购成本可变制造成本运输/发行成本无形磨损费/减价管理/交易成本制造行业的资产分销中心库存51©1999AndersenConsulting成本资产客户战略及财务的影响SCM改善对有战略及财务具有最好的公司得益于巨大的竞争优势.总供应链管理成本“对于年销售收入为20亿及60%的销售成本的企业,中等层次的企业与前20%的企业之间的运营资本的差异为1.76亿美圆。7.06.30%2%4%6%8%10%12%14%19961997收入最好中等37318702040608010012019961997天数现金周转周期13.111.61051997PRTMStudy52©1999AndersenConsulting最好的公司得益于巨大的竞争优势.总供应链管理成本“对于年销售35
温馨提示
- 1. 本站所有资源如无特殊说明,都需要本地电脑安装OFFICE2007和PDF阅读器。图纸软件为CAD,CAXA,PROE,UG,SolidWorks等.压缩文件请下载最新的WinRAR软件解压。
- 2. 本站的文档不包含任何第三方提供的附件图纸等,如果需要附件,请联系上传者。文件的所有权益归上传用户所有。
- 3. 本站RAR压缩包中若带图纸,网页内容里面会有图纸预览,若没有图纸预览就没有图纸。
- 4. 未经权益所有人同意不得将文件中的内容挪作商业或盈利用途。
- 5. 人人文库网仅提供信息存储空间,仅对用户上传内容的表现方式做保护处理,对用户上传分享的文档内容本身不做任何修改或编辑,并不能对任何下载内容负责。
- 6. 下载文件中如有侵权或不适当内容,请与我们联系,我们立即纠正。
- 7. 本站不保证下载资源的准确性、安全性和完整性, 同时也不承担用户因使用这些下载资源对自己和他人造成任何形式的伤害或损失。
最新文档
- 光缆熔接视频课程设计
- 光电警报器课程设计
- 光电光化学转化课程设计
- 光学衍射课程设计
- 光伏离网发电课程设计
- 傅里叶变换课程设计
- 供热工程哈尔滨课程设计
- 佛牌的制作课程设计
- 仿生江豚课程设计
- 个人的课程设计
- 教学方法课件
- 服务型执法知识讲座
- 中国教育行业数字化转型的挑战与机遇
- Part 3-4 Unit 7 Invention and Innovation教案-【中职专用】高一英语精研课堂(高教版2021·基础模块2)
- 盆景行业发展前景分析报告
- 消防档案整改方案
- 类风湿关节炎病情活动度评价表(DAS28)
- 养老机构风险管控清单
- JB-T 2302-2022 双筒网式过滤器 型式、参数与尺寸
- 麻醉医师资格分级授权管理制度
- 石墨散热材料项目商业计划书
评论
0/150
提交评论