


版权说明:本文档由用户提供并上传,收益归属内容提供方,若内容存在侵权,请进行举报或认领
文档简介
1、SOLUTIONS TO TEXT PROBLEMS:Quick Quizzes1.A market is a group of buyers (who determine demand) and a group of sellers (who determine supply) of a particular good or service. A competitive market is one in which there are many buyers and many sellers of an identical product so that each has a negligi
2、ble impact on the market price.2.Heres an example of a demand schedule for pizza:Price of Pizza SliceNumber of Pizza Slices Demanded $ 0.00 100.2590.5080.7571.0061.2551.5041.7532.0022.2512.500The demand curve is graphed in Figure 1. Figure 1Examples of things that would shift the demand curve includ
3、e changes in income, prices of related goods like soda or hot dogs, tastes, expectations about future income or prices, and the number of buyers.A change in the price of pizza would not shift this demand curve; it would only lead us to move from one point to another along the same demand curve.3.Her
4、e is an example of a supply schedule for pizza:Price of Pizza SliceNumber of Pizza Slices Supplied $ 0.00 00.251000.502000.753001.004001.255001.506001.757002.008002.259002.501000The supply curve is graphed in Figure 2.Figure 2Examples of things that would shift the supply curve include changes in pr
5、ices of inputs like tomato sauce and cheese, changes in technology like more efficient pizza ovens or automatic dough makers, changes in expectations about the future price of pizza, or a change in the number of sellers.A change in the price of pizza would not shift this supply curve; it would only
6、move from one point to another along the same supply curve.4.If the price of tomatoes rises, the supply curve for pizza shifts to the left because of the increased price of an input into pizza production, but there is no effect on demand. The shift to the left of the supply curve causes the equilibr
7、ium price to rise and the equilibrium quantity to decline, as Figure 3 shows.If the price of hamburgers falls, the demand curve for pizza shifts to the left because the lower price of hamburgers will lead consumers to buy more hamburgers and less pizza, but there is no effect on supply. The shift to
8、 the left of the demand curve causes the equilibrium price to fall and the equilibrium quantity to decline, as Figure 4 shows.Figure 3 Figure 4Questions for Review1.A competitive market is a market in which there are many buyers and many sellers of an identical product so that each has a negligible
9、impact on the market price. Other types of markets include monopoly, in which there is only one seller, oligopoly, in which there are a few sellers that do not always compete aggressively, and monopolistically competitive markets, in which there are many sellers, each offering a slightly different p
10、roduct.2.The quantity of a good that buyers demand is determined by the price of the good, income, the prices of related goods, tastes, expectations, and the number of buyers.3.The demand schedule is a table that shows the relationship between the price of a good and the quantity demanded. The deman
11、d curve is the downward-sloping line relating price and quantity demanded. The demand schedule and demand curve are related because the demand curve is simply a graph showing the points in the demand schedule.The demand curve slopes downward because of the law of demandother things equal, when the p
12、rice of a good rises, the quantity demanded of the good falls. People buy less of a good when its price rises, both because they cannot afford to buy as much and because they switch to purchasing other goods.4.A change in consumers' tastes leads to a shift of the demand curve. A change in price
13、leads to a movement along the demand curve.5.Since Popeye buys more spinach when his income falls, spinach is an inferior good for him. Since he buys more spinach, but the price of spinach is unchanged, his demand curve for spinach shifts out as a result of the decrease in his income.6.The quantity
14、of a good that sellers supply is determined by the price of the good, input prices, technology, expectations, and the number of sellers.7.A supply schedule is a table showing the relationship between the price of a good and the quantity a producer is willing and able to supply. The supply curve is t
15、he upward-sloping line relating price and quantity supplied. The supply schedule and the supply curve are related because the supply curve is simply a graph showing the points in the supply schedule.The supply curve slopes upward because when the price is high, suppliers' profits increase, so th
16、ey supply more output to the market. The result is the law of supplyother things equal, when the price of a good rises, the quantity supplied of the good also rises.8.A change in producers' technology leads to a shift in the supply curve. A change in price leads to a movement along the supply cu
17、rve.9.The equilibrium of a market is the point at which the quantity demanded is equal to quantity supplied. If the price is above the equilibrium price, sellers want to sell more than buyers want to buy, so there is a surplus. Sellers try to increase their sales by cutting prices. That continues un
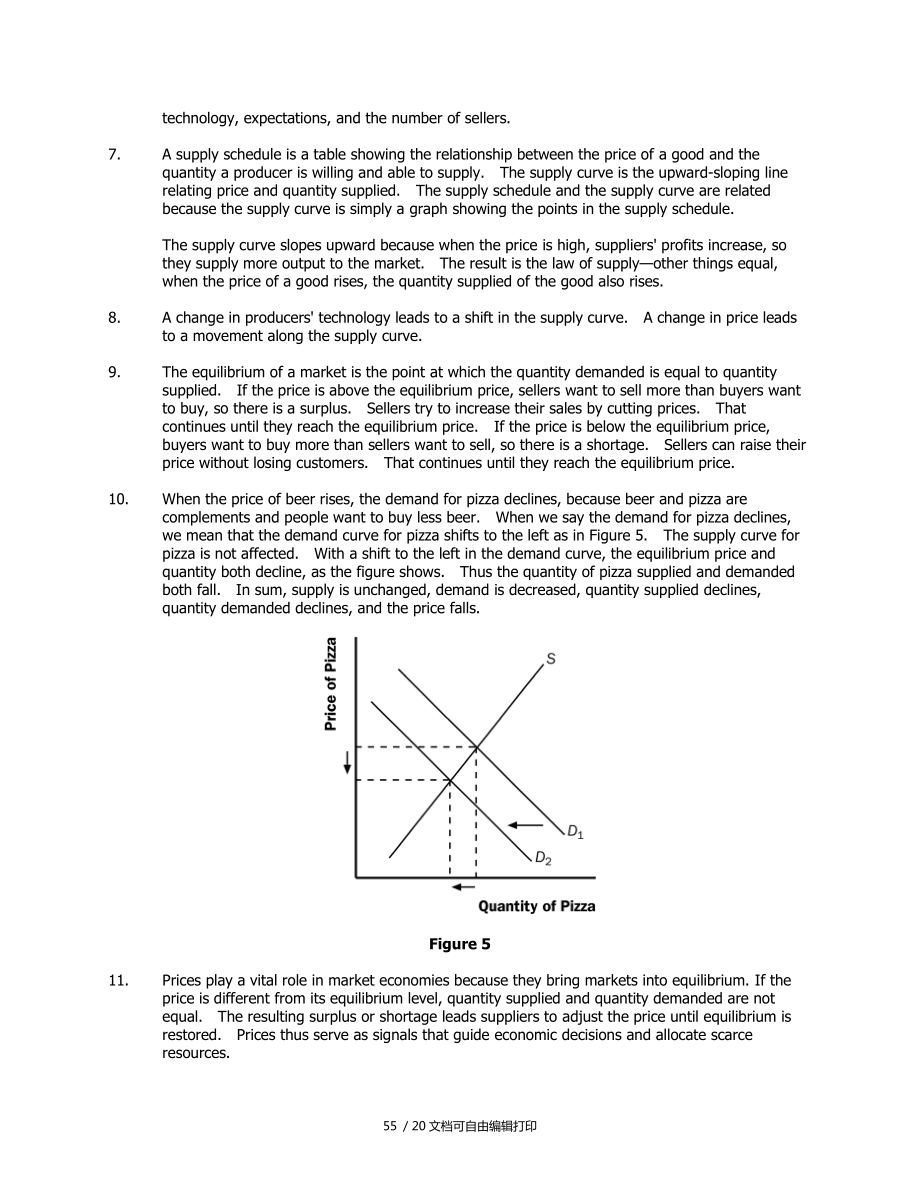
18、til they reach the equilibrium price. If the price is below the equilibrium price, buyers want to buy more than sellers want to sell, so there is a shortage. Sellers can raise their price without losing customers. That continues until they reach the equilibrium price.10.When the price of beer rises,
19、 the demand for pizza declines, because beer and pizza are complements and people want to buy less beer. When we say the demand for pizza declines, we mean that the demand curve for pizza shifts to the left as in Figure 5. The supply curve for pizza is not affected. With a shift to the left in the d
20、emand curve, the equilibrium price and quantity both decline, as the figure shows. Thus the quantity of pizza supplied and demanded both fall. In sum, supply is unchanged, demand is decreased, quantity supplied declines, quantity demanded declines, and the price falls.Figure 511.Prices play a vital
21、role in market economies because they bring markets into equilibrium. If the price is different from its equilibrium level, quantity supplied and quantity demanded are not equal. The resulting surplus or shortage leads suppliers to adjust the price until equilibrium is restored. Prices thus serve as
22、 signals that guide economic decisions and allocate scarce resources.Problems and Applications1.a.Cold weather damages the orange crop, reducing the supply of oranges. This can be seen in Figure 6 as a shift to the left in the supply curve for oranges. The new equilibrium price is higher than the ol
23、d equilibrium price.Figure 6b.People often travel to the Caribbean from New England to escape cold weather, so demand for Caribbean hotel rooms is high in the winter. In the summer, fewer people travel to the Caribbean, since northern climes are more pleasant. The result, as shown in Figure 7, is a
24、shift to the left in the demand curve. The equilibrium price of Caribbean hotel rooms is thus lower in the summer than in the winter, as the figure shows.Figure 7c.When a war breaks out in the Middle East, many markets are affected. Since much oil production takes place there, the war disrupts oil s
25、upplies, shifting the supply curve for gasoline to the left, as shown in Figure 8. The result is a rise in the equilibrium price of gasoline. With a higher price for gasoline, the cost of operating a gas-guzzling automobile, like a Cadillac, will increase. As a result, the demand for used Cadillacs
26、will decline, as people in the market for cars will not find Cadillacs as attractive. In addition, some people who already own Cadillacs will try to sell them. The result is that the demand curve for used Cadillacs shifts to the left, while the supply curve shifts to the right, as shown in Figure 9.
27、 The result is a decline in the equilibrium price of used Cadillacs.Figure 8Figure 92.The statement that "an increase in the demand for notebooks raises the quantity of notebooks demanded, but not the quantity supplied," in general, is false. As Figure 10 shows, the increase in demand for
28、notebooks results in an increased quantity supplied. The only way the statement would be true is if the supply curve was a vertical line, as shown in Figure 11.Figure 10Figure 113.a.If people decide to have more children (a change in tastes), they will want larger vehicles for hauling their kids aro
29、und, so the demand for minivans will increase. Supply won't be affected. The result is a rise in both price and quantity, as Figure 12 shows.Figure 12b.If a strike by steelworkers raises steel prices, the cost of producing a minivan rises (a rise in input prices), so the supply of minivans decre
30、ases. Demand won't be affected. The result is a rise in the price of minivans and a decline in the quantity, as Figure 13 shows.Figure 13c.The development of new automated machinery for the production of minivans is an improvement in technology. The reduction in firms' costs results in an in
31、crease in supply. Demand isn't affected. The result is a decline in the price of minivans and an increase in the quantity, as Figure 14 shows.Figure 14d.The rise in the price of sport utility vehicles affects minivan demand because sport utility vehicles are substitutes for minivans (that is, th
32、ere is a rise in the price of a related good). The result is an increase in demand for minivans. Supply is not affected. In equilibrium, the price and quantity of minivans both rise, as Figure 12 shows.e.The reduction in peoples' wealth caused by a stock-market crash reduces their income, leadin
33、g to a reduction in the demand for minivans, since minivans are likely a normal good. Supply isnt affected. As a result, both price and quantity decline, as Figure 15 shows.Figure 154.Technological advances that reduce the cost of producing computer chips represent a decline in an input price for pr
34、oducing a computer. The result is a shift to the right in the supply of computers, as shown in Figure 16. The equilibrium price falls and the equilibrium quantity rises, as the figure shows.Figure 16Since computer software is a complement to computers, the lower equilibrium price of computers increa
35、ses the demand for software. As Figure 17 shows, the result is a rise in both the equilibrium price and quantity of software.Figure 17Since typewriters are substitutes for computers, the lower equilibrium price of computers reduces the demand for typewriters. As Figure 18 shows, the result is a decl
36、ine in both the equilibrium price and quantity of typewriters.Figure 185.a.When a hurricane in South Carolina damages the cotton crop, it raises input prices for producing sweatshirts. As a result, the supply of sweatshirts shifts to the left, as shown in Figure 19. The new equilibrium has a higher
37、price and lower quantity of sweatshirts.Figure 19b.A decline in the price of leather jackets leads more people to buy leather jackets, reducing the demand for sweatshirts. The result, shown in Figure 20, is a decline in both the equilibrium price and quantity of sweatshirts.Figure 20c.The effects of
38、 colleges requiring students to engage in morning calisthenics in appropriate attire raises the demand for sweatshirts, as shown in Figure 21. The result is an increase in both the equilibrium price and quantity of sweatshirts.Figure 21d.The invention of new knitting machines increases the supply of
39、 sweatshirts. As Figure 22 shows, the result is a reduction in the equilibrium price and an increase in the equilibrium quantity of sweatshirts.Figure 226.A temporarily high birth rate in the year 2005 leads to opposite effects on the price of babysitting services in the years 2010 and 2020. In the
40、year 2010, there are more 5-year olds who need sitters, so the demand for babysitting services rises, as shown in Figure 23. The result is a higher price for babysitting services in 2010. However, in the year 2020, the increased number of 15-year olds shifts the supply of babysitting services to the
41、 right, as shown in Figure 24. The result is a decline in the price of babysitting services.Figure 23Figure 247.Since ketchup is a complement for hot dogs, when the price of hot dogs rises, the quantity demanded of hot dogs falls, thus reducing the demand for ketchup, causing both price and quantity
42、 of ketchup to fall. Since the quantity of ketchup falls, the demand for tomatoes by ketchup producers falls, so both price and quantity of tomatoes fall. When the price of tomatoes falls, producers of tomato juice face lower input prices, so the supply curve for tomato juice shifts out, causing the
43、 price of tomato juice to fall and the quantity of tomato juice to rise. The fall in the price of tomato juice causes people to substitute tomato juice for orange juice, so the demand for orange juice declines, causing the price and quantity of orange juice to fall. Now you can see clearly why a ris
44、e in the price of hot dogs leads to a fall in price of orange juice!Figure 258.a.Cigars and chewing tobacco are substitutes for cigarettes, since a higher price for cigarettes would increase the demand for cigars and chewing tobacco.b.An increase in the tax on cigarettes leads to increased demand fo
45、r cigars and chewing tobacco. The result, as shown in Figure 25 for cigars, is a rise in both the equilibrium price and quantity of cigars and chewing tobacco.c.The results in part (b) showed that a tax on cigarettes leads people to substitute cigars and chewing tobacco for cigarettes when the tax o
46、n cigarettes rises. To reduce total tobacco usage, policymakers might also want to increase the tax on cigars and chewing tobacco, or pursue some type of public education program.9.Quantity supplied equals quantity demanded at a price of $6 and quantity of 81 pizzas (Figure 26). If price were greate
47、r than $6, quantity supplied would exceed quantity demanded, so suppliers would reduce their price to gain sales. If price were less than $6, quantity demanded would exceed quantity supplied, so suppliers could raise their price without losing sales. In both cases, the price would continue to adjust
48、 until it reached $6, the only price at which there is neither a surplus nor a shortage.Figure 2610.a.If the price of flour falls, since flour is an ingredient in bagels, the supply curve for bagels would shift to the right. The result, shown in Figure 27, would be a fall in the price of bagels and
49、a rise in the equilibrium quantity of bagels.Figure 27Since cream cheese is a complement to bagels, the fall in the equilibrium price of bagels increases the demand for cream cheese, as shown in Figure 28. The result is a rise in both the equilibrium price and quantity of cream cheese. So, a fall in
50、 the price of flour indeed raises both the equilibrium price of cream cheese and the equilibrium quantity of bagels.Figure 28What happens if the price of milk falls? Since milk is an ingredient in cream cheese, the fall in the price of milk leads to an increase in the supply of cream cheese. This le
51、ads to a decrease in the price of cream cheese (Figure 29), rather than a rise in the price of cream cheese. So a fall in the price of milk could not have been responsible for the pattern observed.Figure 29b.In part (a), we found that a fall in the price of flour led to a rise in the price of cream
52、cheese and a rise in the equilibrium quantity of bagels. If the price of flour rose, the opposite would be true; it would lead to a fall in the price of cream cheese and a fall in the equilibrium quantity of bagels. Since the question says the equilibrium price of cream cheese has risen, it could no
53、t have been caused by a rise in the price of flour.What happens if the price of milk rises? From part (a), we found that a fall in the price of milk caused a decline in the price of cream cheese, so a rise in the price of milk would cause a rise in the price of cream cheese. Since bagels and cream c
54、heese are complements, the rise in the price of cream cheese would reduce the demand for bagels, as Figure 30 shows. The result is a decline in the equilibrium quantity of bagels. So a rise in the price of milk does cause both a rise in the price of cream cheese and a decline in the equilibrium quantity of bagels.Fig
温馨提示
- 1. 本站所有资源如无特殊说明,都需要本地电脑安装OFFICE2007和PDF阅读器。图纸软件为CAD,CAXA,PROE,UG,SolidWorks等.压缩文件请下载最新的WinRAR软件解压。
- 2. 本站的文档不包含任何第三方提供的附件图纸等,如果需要附件,请联系上传者。文件的所有权益归上传用户所有。
- 3. 本站RAR压缩包中若带图纸,网页内容里面会有图纸预览,若没有图纸预览就没有图纸。
- 4. 未经权益所有人同意不得将文件中的内容挪作商业或盈利用途。
- 5. 人人文库网仅提供信息存储空间,仅对用户上传内容的表现方式做保护处理,对用户上传分享的文档内容本身不做任何修改或编辑,并不能对任何下载内容负责。
- 6. 下载文件中如有侵权或不适当内容,请与我们联系,我们立即纠正。
- 7. 本站不保证下载资源的准确性、安全性和完整性, 同时也不承担用户因使用这些下载资源对自己和他人造成任何形式的伤害或损失。
最新文档
- 中级会计职称考试试题及答案
- 长期卧床病人并发症的预防和处理考核试题及答案
- 河北省河北衡水中学2025-2026学年高一下学期7月期末考试生物试题(文字版含答案)
- 天津铁道职业技术学院单招职业技能考试题库及答案
- 甘肃省兰州市七里河区2026年六年级下英语期末试卷(文字版含答案)
- 监理工程师再教育模板工程质量通病及预防措施试题及答案
- 广西体育高等专科学校单招职业技能考试题库及答案
- 电工双重预防体系建设培训试题及答案
- 房地产估价理论与方法课件 (模块三 现场查勘)
- 2026年郑州工业应用技术学院单招职业技能考试题库及答案
- 2026新教材人教版九年级上册英语暑假预习:Unit 1 The Changing World 词汇详解
- 护栏安装工程承揽协议
- 2026驾照科目一全新全攻略:新规解读、核心考点与零基础通关指南
- 、2026 广州中考历史 试卷
- 2026年建筑电工(建筑特殊工种)考试题库及答案
- 2026年云南省中考物理真题
- 2026年秋国家开放大学国开电大机考期末园艺植物栽培学总论试题及答案
- 水利水电工程单元工程施工质量检验表与验收表(SLT631.5-2025)
- 肺结核咯血患者的护理未来发展趋势
- 隧道检测安全管理课件
- 野外安全生产制度
评论
0/150
提交评论