

版权说明:本文档由用户提供并上传,收益归属内容提供方,若内容存在侵权,请进行举报或认领
文档简介
本文格式为Word版,下载可任意编辑——使用DevExpress的WebChartControl控件绘制图表(柱状图折线图使用DevExpress的WebChartControl控件绘制图表(柱状图、折线图、饼图)
WebChartControl是DevExpress控件群下的一个Web图表控件,它使用十分的便利,生成的图表也相当的漂亮。
先贴出几张WebChartControl生成的图表:
Web页面代码WebChartControl.aspx:ViewCode
12
35
67
8
9
101314
152829
Web页面后台代码WebChartControl.aspx.csViewCode
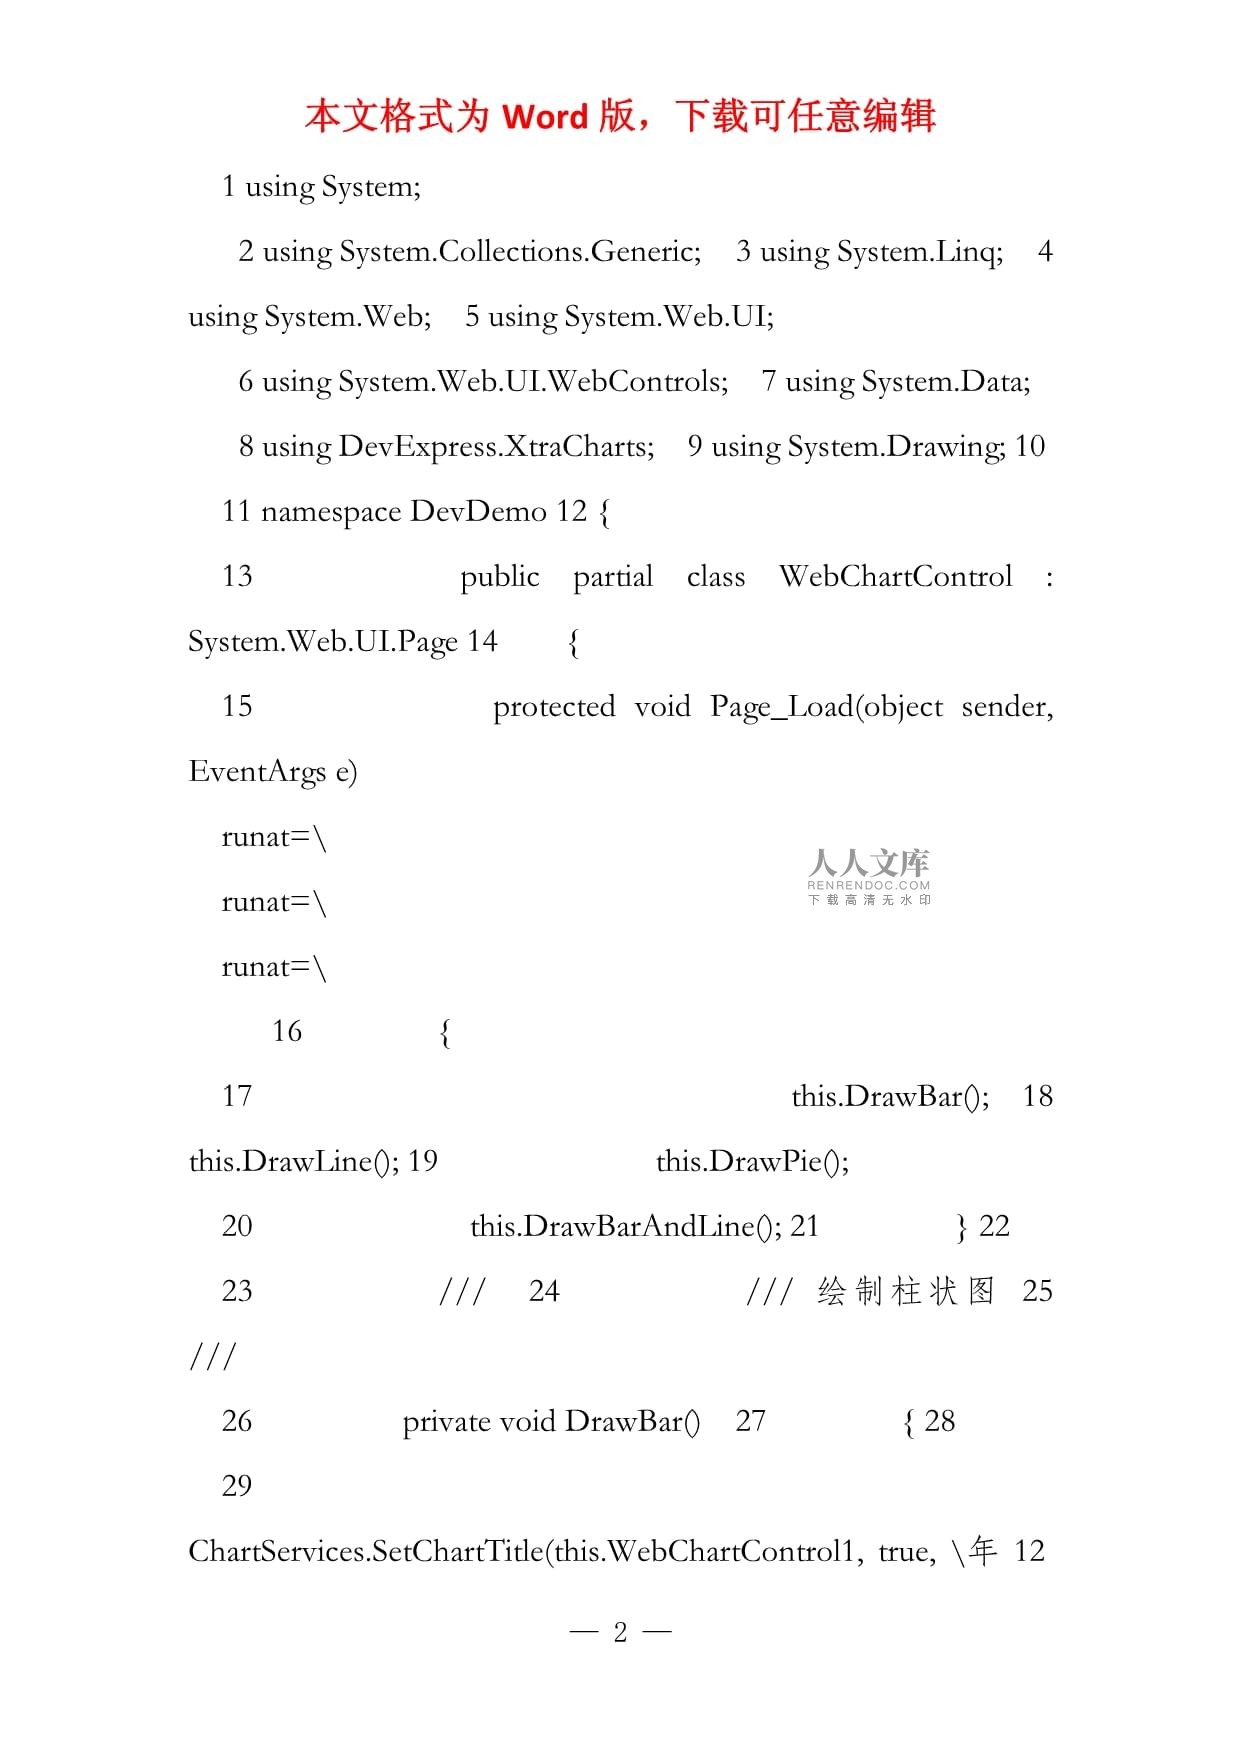
1usingSystem;
2usingSystem.Collections.Generic;3usingSystem.Linq;4usingSystem.Web;5usingSystem.Web.UI;
6usingSystem.Web.UI.WebControls;7usingSystem.Data;
8usingDevExpress.XtraCharts;9usingSystem.Drawing;10
11namespaceDevDemo12{
13publicpartialclassWebChartControl:System.Web.UI.Page14{
15protectedvoidPage_Load(objectsender,EventArgse)
runat=\
runat=\
runat=\
16{
17this.DrawBar();18this.DrawLine();19this.DrawPie();
20this.DrawBarAndLine();21}22
23///24///绘制柱状图25///
26privatevoidDrawBar()27{28
29ChartServices.SetChartTitle(this.WebChartControl1,true,\年12月第1周收入状况\,true,2,StringAlignment.Center,ChartTitleDockStyle.Top,true,newFont(\宋体\,12,FontStyle.Bold),Color.Red,10);//如不需显示图表标题可不用调用本段代码,下同
30ChartServices.DrawChart(this.WebChartControl1,\收益\,ViewType.Bar,ServiceData.GetWeekMoneyAndCost(),\,\);
31ChartServices.DrawChart(this.WebChartControl1,\成本\,ViewType.Bar,ServiceData.GetWeekMoneyAndCost(),\,\);
32ChartServices.SetAxisX(this.WebChartControl1,true,StringAlignment.Center,\星期\,Color.Red,true,newFont(\宋体\,12,FontStyle.Bold));//如不需显示X轴标题,可不调用该行代码,下同
33ChartServices.SetAxisY(this.WebChartControl1,true,StringAlignment.Center,\金额\,Color.Red,true,newFont(\宋体\,12,FontStyle.Bold));//如不需显示Y轴标题,可不调用该行代码,下同34}35
36///37///绘制折线图38///
39privatevoidDrawLine()40{
41ChartServices.SetChartTitle(this.WebChartControl3,true,\年12月第1周收入状况\,true,2,StringAlignment.Center,ChartTitleDockStyle.Top,true,newFont(\宋体\,12,FontStyle.Bold),Color.Red,10);
42ChartServices.DrawChart(this.WebChartControl3,\收益\,ViewType.Line,ServiceData.GetWeekMoneyAndCost(),\,\);
43ChartServices.DrawChart(this.WebChartControl3,\成本\,ViewType.Line,ServiceData.GetWeekMoneyAndCost(),\,\);
44ChartServices.SetAxisX(this.WebChartControl3,true,StringAlignment.Center,\星期\,Color.Red,true,newFont(\宋体\,12,FontStyle.Bold));
45ChartServices.SetAxisY(this.WebChartControl3,true,StringAlignment.Center,\金额\,Color.Red,true,newFont(\宋体\,12,FontStyle.Bold));
46}47
48///
49///柱状图和折线图在同一图表中50///
51privatevoidDrawBarAndLine()52{
53ChartServices.SetChartTitle(this.WebChartControl2,true,\年12月第1周收入状况\,true,2,StringAlignment.Center,ChartTitleDockStyle.Top,true,newFont(\宋体\,12,FontStyle.Bold),Color.Red,10);
54ChartServices.DrawChart(this.WebChartControl2,\收益\,ViewType.Bar,ServiceData.GetWeekMoneyAndCost(),\,\);
55ChartServices.DrawChart(this.WebChartControl2,\成本\,ViewType.Bar,ServiceData.GetWeekMoneyAndCost(),\,\);
56ChartServices.SetAxisX(this.WebChartControl2,true,StringAlignment.Center,\星期\,Color.Red,true,newFont(\宋体\,12,FontStyle.Bold));
57ChartServices.SetAxisY(this.WebChartControl2,true,StringAlignment.Center,\金额\,Color.Red,true,newFont(\宋体\,12,FontStyle.Bold));58
59ChartServices.SetChartTitle(this.WebChartControl2,false,\年12月第1周收入状况\,true,2,StringAlignment.Center,ChartTitleDockStyle.Top,true,newFont(\宋体\,12,FontStyle.Bold),Color.Red,10);
60ChartServices.DrawChart(this.WebChartControl2,\收益\,ViewType.Line,ServiceData.GetWeekMoneyAndCost(),\,\);
61ChartServices.DrawChart(this.WebChartControl2,\成本\,ViewType.Line,ServiceData.GetWeekMoneyAndCost(),\,\);
62ChartServices.SetAxisX(this.WebChartControl2,true,StringAlignment.Center,\星期\,Color.Red,true,newFont(\宋体\,12,FontStyle.Bold));
63ChartServices.SetAxisY(this.WebChartControl2,true,StringAlignment.Center,\金额\,Color.Red,true,newFont(\宋体\,12,FontStyle.Bold));64}65
66///67///绘制饼图68///
69privatevoidDrawPie()70{
71ChartServices.SetChartTitle(this.WebChartControl4,true,\年12月第1周收入状况\,true,2,StringAlignment.Center,ChartTitleDockStyle.Top,true,newFont(\宋体\,12,FontStyle.Bold),Color.Red,10);
72ChartServices.DrawChart(this.WebChartControl4,ServiceData.GetWeekMoneyAndCost().Rows[0][0].ToString(),ViewType.Pie,ServiceData.GetWeekMoneyAndCost(),\,\);73}
74}75}
数据提供类ServiceData.cs,主要作用为图表控件提供数据源ViewCode
1usingSystem;
2usingSystem.Collections.Generic;3usingSystem.Linq;4usingSystem.Web;5usingSystem.Data;6
7namespaceDevDemo8{
9publicstaticclassServiceData10{
11///
12///获取一周收入和支出数据13///
14///Datatable数据集合(可从数据库读取以datatable形式返回,此处为演示便利直接构造)
15publicstaticDataTableGetWeekMoneyAndCost()16{
17DataTabledt=newDataTable();
18dt.Columns.Add(\,typeof(string));19dt.Columns.Add(\,typeof(decimal));20dt.Columns.Add(\,typeof(decimal));21
22dt.Rows.Add(\星期一\,1200,400);23dt.Rows.Add(\星期二\,1800,750);24dt.Rows.Add(\星期三\,890,320);25dt.Rows.Add(\星期四\,1080,290);26dt.Rows.Add(\星期五\,2800,1020);27dt.Rows.Add(\星期六\,3200,1260);28dt.Rows.Add(\星期日\,4500,2320);29returndt;30}31}32}
图表控件辅助类ChartServices.cs,控制生成图表ViewCode
1usingSystem;
2usingSystem.Collections.Generic;3usingSystem.Linq;4usingSystem.Web;5usingSystem.Drawing;
6usingDevExpress.XtraCharts;7usingSystem.Data;8
9namespaceDevDemo10{
11publicstaticclassChartServices12{
13///14///绘制图形15///
16///17///18///19///20///22publicstaticvoidDrawChart(DevExpress.XtraCharts.Web.WebChartControlcontrol,stringseriesName,ViewTypetype,DataTabledt,stringcolumn1,stringcolumn2)23{
24Seriesseries=newSeries(seriesName,type);25DataTabletable=dt;26SeriesPointpoint=null;
27for(inti=0;i49///设置图表标题50///
51///
52//////53///
54///
55///56///57///
58///59///
60///61///
62publicstaticvoidSetChartTitle(DevExpress.XtraCharts.Web.WebChartControlcontrol,boolisVisible,Stringtext,boolisWordWrop,intmaxLineCount,StringAlignmentalignment,ChartTitleDockStyledock,boolisAntialiasing,Fontfont,ColortextColor,intindent)63{
64//设置标题
65ChartTitletitle=newChartTitle();66title.Visible=isVisible;67//显示文本68title.Text=text;69//是否允许换行
70title.WordWrap=isWordWrop;71//最大允许行数
72title.MaxLineCount=maxLineCount;73//对齐方式
74title.Alignment=alignment;75//位置
76title.Dock=dock;77//是否允许设置外观
78title.Antialiasing=isAntialiasing;79//字体
80title.Font=font;81//字体颜色
82title.TextColor=textColor;83//缩进值
84title.Indent=indent;85control.Titles.Add(title);86}8788
89///
90///为X轴添加标题91///
92///
93///94///95///96///
97///98///
99publicstaticvoidSetAxisX(DevExpress.XtraCharts.Web.WebChartControlcontrol,boolisVisible,StringAlignmentaligment,stringtext,Colorcolor,boolisAntialiasing,Fontfont)100{
101XYDiagramxydiagram=(XYDiagram)control.Diagram;102xydiagram.AxisX.Title.Visible=isVisible;103xydiagram.AxisX.Title.Alignment=aligment;104xydiagram.AxisX.Title.Text=text;
105xydiagram.AxisX.Title.TextColor=color;
106xydiagram.AxisX.Title.Antialiasing=isAntialiasing;107xydiagra
温馨提示
- 1. 本站所有资源如无特殊说明,都需要本地电脑安装OFFICE2007和PDF阅读器。图纸软件为CAD,CAXA,PROE,UG,SolidWorks等.压缩文件请下载最新的WinRAR软件解压。
- 2. 本站的文档不包含任何第三方提供的附件图纸等,如果需要附件,请联系上传者。文件的所有权益归上传用户所有。
- 3. 本站RAR压缩包中若带图纸,网页内容里面会有图纸预览,若没有图纸预览就没有图纸。
- 4. 未经权益所有人同意不得将文件中的内容挪作商业或盈利用途。
- 5. 人人文库网仅提供信息存储空间,仅对用户上传内容的表现方式做保护处理,对用户上传分享的文档内容本身不做任何修改或编辑,并不能对任何下载内容负责。
- 6. 下载文件中如有侵权或不适当内容,请与我们联系,我们立即纠正。
- 7. 本站不保证下载资源的准确性、安全性和完整性, 同时也不承担用户因使用这些下载资源对自己和他人造成任何形式的伤害或损失。
最新文档
- 2026湖北十堰市丹江口市卫生健康局所属事业单位选聘14人参考考试试题附答案解析
- 2026湖南益阳南县高新投资集团有限公司招聘2人备考考试题库附答案解析
- 2026北京朝阳航空工业机载低空经济事业部招聘备考考试试题附答案解析
- 军需生产规章制度
- 生产工程部门管理制度
- 车间安全生产与6s规划管理制度
- 控制器生产日常管理制度
- 餐饮安全生产投入制度
- 2026年西安交响乐团第一季度招聘备考考试题库附答案解析
- 监控室安全生产管理制度
- 2026中国电信四川公用信息产业有限责任公司社会成熟人才招聘备考题库带答案详解
- 2026云南大理州事业单位招聘48人参考题库必考题
- 《公共科目》军队文职考试新考纲题库详解(2026年)
- 2025至2030中国啤酒市场行业调研及市场前景预测评估报告
- 报警受理工作制度规范
- 嘉宾邀请合同书
- 家庭学校社会协同育人课件
- 基于python-的车牌识别
- 《LTCC生产流程》课件
- 年度工作总结PPT模板
- 7KW交流交流充电桩说明书

评论
0/150
提交评论