


版权说明:本文档由用户提供并上传,收益归属内容提供方,若内容存在侵权,请进行举报或认领
文档简介
DIGITAL
&
TRENDSSocialmediaadvertisingintheU.S.(DMI)CHAPTER
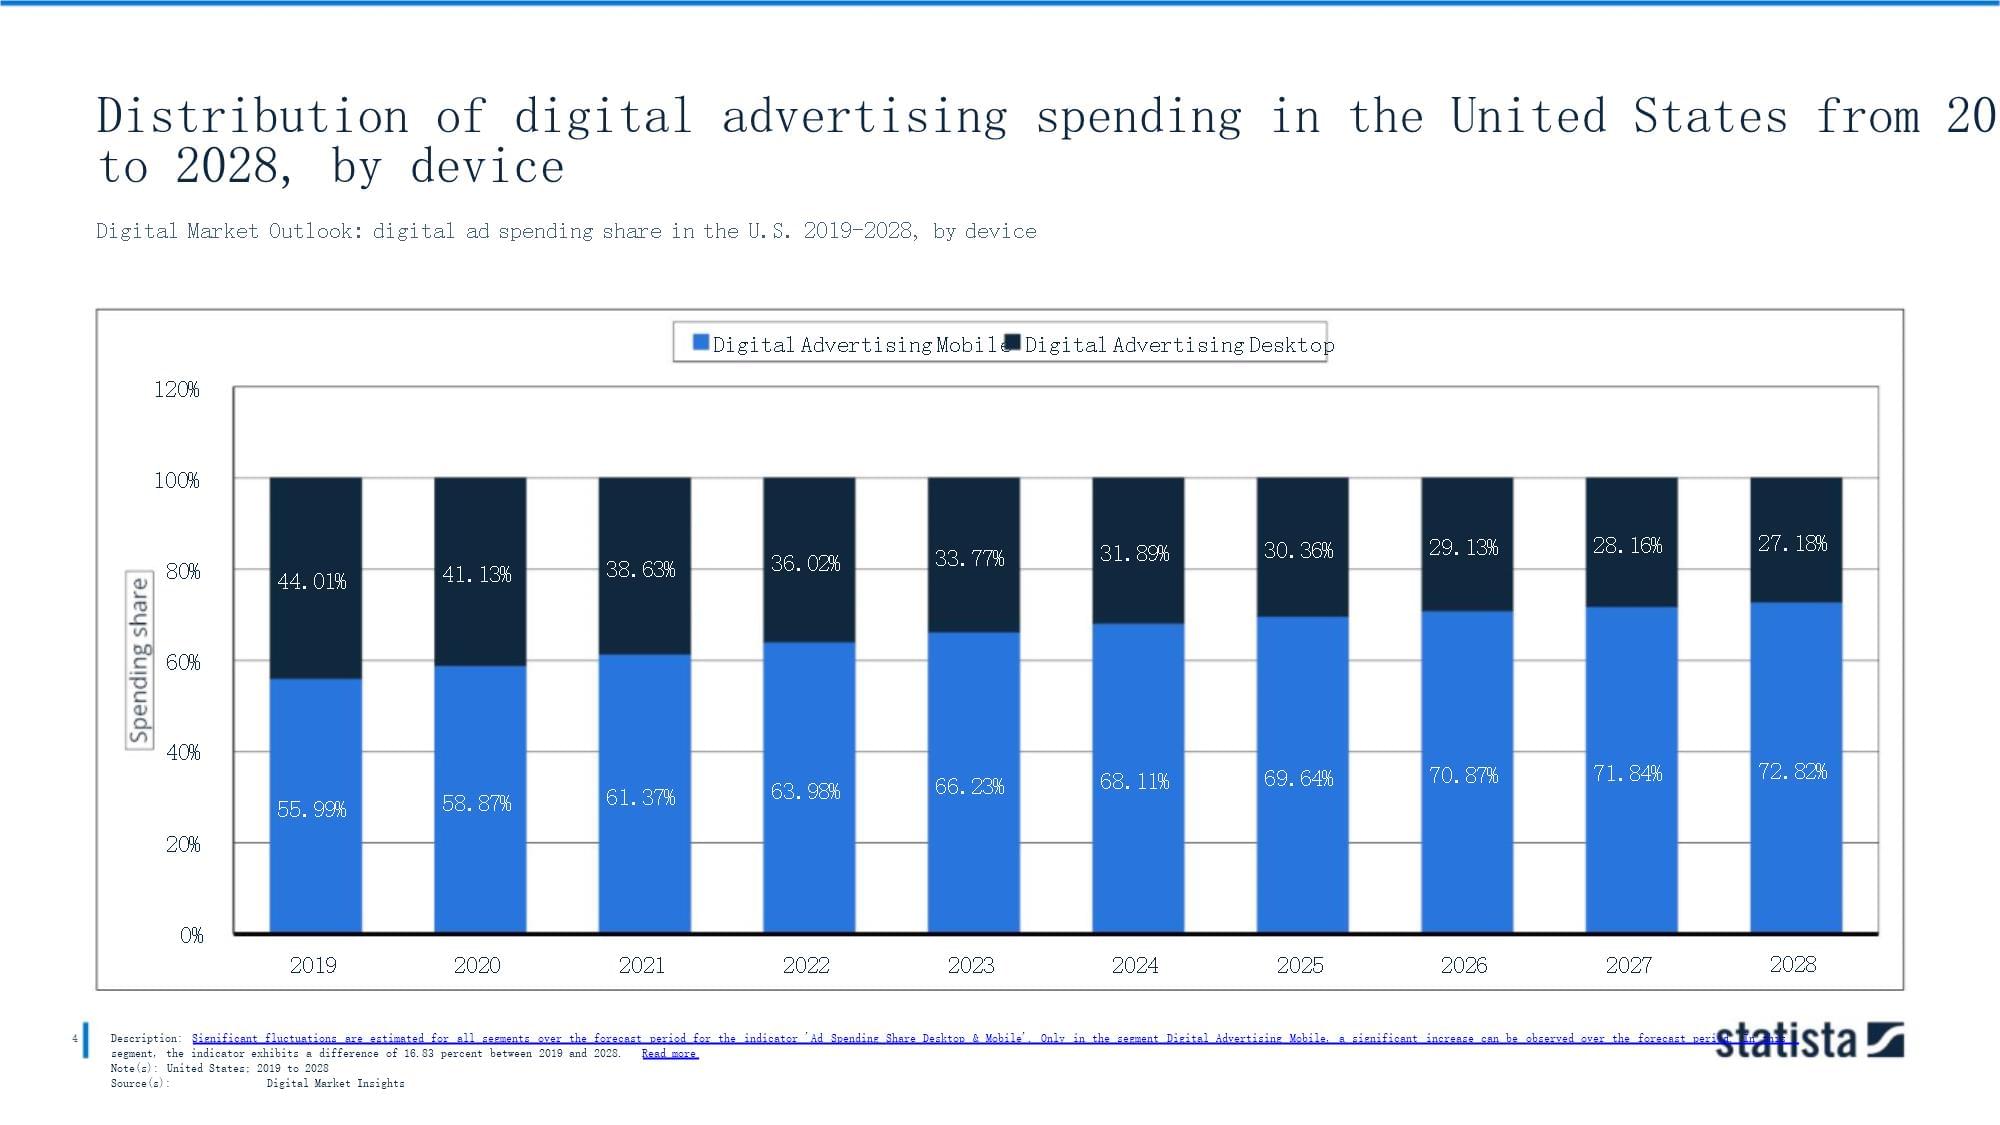
01OverviewDigitaladvertisingspendingintheUnitedStatesfrom2019to2028,byformat(inbillionU.S.dollars)DigitalMarketOutlook:digitaladvertisingspendingintheU.S.2019-2028,byformatSearchAdvertisingVideoAdvertisingBannerAdvertisingClassifieds45040035030025020015010050020192020202120222023202420252026202720283Description:Overthelasttwoobservations,theadspendingisforecasttosignificantlyincreaseinallsegments.Aspartofthepositivetrend,theindicatorachievesthemaximumvalueacrossallfourdifferentsegmentsbytheendofthecomparisonperiod.Notably,thesegmentSearchAdvertisingstandsoutwiththehighestvalueof188.56billionU.S.dollars.ReadmoreNote(s):UnitedStates;2019to2028Source(s):DigitalMarketInsightsDistributionofdigitaladvertisingspendingintheUnitedStatesfrom2019to2028,bydeviceDigitalMarketOutlook:digitaladspendingshareintheU.S.2019-2028,bydeviceDigitalAdvertisingMobileDigitalAdvertisingDesktop120%100%29.13%28.16%27.18%30.36%31.89%33.77%36.02%80%60%40%20%0%38.63%41.13%44.01%70.87%202671.84%202772.82%202869.64%202568.11%202466.23%202363.98%202261.37%202158.87%202055.99%20194Description:Significantfluctuationsareestimatedforallsegmentsovertheforecastperiodfortheindicator'AdSpendingShareDesktop&Mobile'.OnlyinthesegmentDigitalAdvertisingMobile,asignificantincreasecanbeobservedovertheforecastperiod.Inthissegment,theindicatorexhibitsadifferenceof16.83percentbetween2019and2028.ReadmoreNote(s):UnitedStates;2019to2028Source(s):DigitalMarketInsightsDistributionofdigitalclassifiedsadvertisingspendingintheUnitedStatesfrom2019to2028,bydeviceDigitalMarketOutlook:digitalclassifiedsadspendshareU.S.2019-2028,bydeviceClassifiedsMobileClassifiedsDesktop120%100%29.41%28.68%27.95%30.87%30.14%32.33%31.6%33.33%34.79%37.03%80%60%40%20%0%70.59%202671.32%202772.05%202869.13%202469.86%202567.67%202268.4%202366.67%202165.21%202062.97%20195Description:Significantfluctuationsareestimatedforallsegmentsovertheforecastperiodfortheindicator'AdSpendingShareDesktop&Mobile'.OnlyinthesegmentClassifiedsMobile,asignificantincreasecanbeobservedovertheforecastperiod.Inthissegment,theindicatorexhibitsadifferenceof9.08percentbetween2019and2028.ReadmoreNote(s):UnitedStates;2019to2028Source(s):DigitalMarketInsightsCHAPTER
02RevenueRevenueofthesocialmediaadvertisingmarketintheUnitedStatesfrom2019to2028(inbillionU.S.dollars)RevenueofthesocialmediaadvertisingindustryintheU.S.2019-20281009088.0885.3182.5379.668076.472.3366.6570605040302010063.1449.1338.4420192020202120222023202420252026202720287Description:Theadspendinginthe'SocialMediaAdvertising'segmentofthedigitaladvertisingmarketintheUnitedStateswasforecasttocontinuouslyincreasebetween2023and2028byintotal15.8billionU.S.dollars(+21.84percent).Aftertheninthconsecutiveincreasingyear,theindicatorisestimatedtoreach88.08billionU.S.dollarsandthereforeanewpeakin2028.Notably,theadspendingofthe'SocialMediaAdvertising'segmentofthedigitaladvertisingmarketwascontinuously[...]
ReadmoreNote(s):UnitedStates;2019to2028Source(s):DigitalMarketInsightsSocialmediaadvertisingspendingintheUnitedStatesfrom2018to2027,bydevice(inbillionU.S.dollars)DigitalMarketOutlook:socialmediaadspendintheU.S.2018-2027,bydeviceBannerAdvertisingMobileBannerAdvertisingDesktop9080706017.7817.1616.6316.1615.785040302010015.4815.8814.8614.4960.72202757.66202614.0454.49202550.96202446.93202342.28202238.64202131.25202025.821.21201820198Description:Theadspendingisforecasttoexperiencesignificantgrowthinallsegmentsin2027.Aspartofthepositivetrend,theindicatorachievethemaximumvalueacrossalltwodifferentsegmentsbytheendofthecomparisonperiod.Notably,thesegmentBannerAdvertisingMobilestandsoutwiththehighestvalueof60.72billionU.S.dollars.ReadmoreNote(s):UnitedStates;2018to2027Source(s):DigitalMarketInsightsRevenuegrowthofsocialmediaadvertisingintheUnitedStatesfrom2019to2028RevenuegrowthofsocialmediaadvertisingintheU.S.2019-202835%29.76%28.52%30%25%20%15%10%5%27.81%8.53%20235.55%20225.62%20244.27%20253.6%20263.36%20273.25%20280%2019202020219Description:Theadspendinggrowthinthe'SocialMediaAdvertising'segmentofthedigitaladvertisingmarketintheUnitedStateswasforecasttocontinuouslydecreasebetween2023and2028byintotal5.3percentagepoints.Afterthefifthconsecutivedecreasingyear,theindicatorisestimatedtoreach3.25percentandthereforeanewminimumin2028.ReadmoreNote(s):UnitedStates;2019to2028Source(s):DigitalMarketInsightsSocialmediaadvertisingspendinggrowthintheUnitedStatesfrom2020to2028,bydeviceDigitalMarketOutlook:socialmediaadspendchangeU.S.2020-2028,bydeviceSocialMediaAdvertisingMobileSocialMediaAdvertisingDesktop35%30%25%20%15%10%5%33.04%30.92%15.97%8.77%6.97%6.27%1.29%20225.99%20205.7%5.12%44.
1.
31%%20253.6515%20263.375%20273.264%20280%20212023202410Description:In2028,theadspendinggrowthisforecasttosignificantlydecreaseinallsegmentscomparedtotheprevioustimepoint.Comparingthetwodifferentsegmentsfortheyear2028,thesegment'SocialMediaAdvertisingMobile'leadstherankingwith3.26percent.Contrastingly,'SocialMediaAdvertisingDesktop'isrankedlast,with3.24percent.Theirdifference,comparedtoSocialMediaAdvertisingMobile,liesat0.0200percentagepoints.ReadmoreNote(s):UnitedStates;2020to2028Source(s):DigitalMarketInsightsAdspendingperinternetuserofthesocialmediaadvertisingmarketintheUnitedStatesfrom2019to2028(inU.S.dollars)AdspendingperinternetuserofsocialmediaadvertisingintheU.S.2019-2028300265.17259.65254.13248.34241.3425020015010050231.76216.85208.89165.34132.330201920202021202220232024202520262027202811Description:Theaverageadspendingperinternetuserinthe'SocialMediaAdvertising'segmentofthedigitaladvertisingmarketintheUnitedStateswasforecasttocontinuouslyincreasebetween2023and2028byintotal33.4U.S.dollars(+14.41percent).Aftertheninthconsecutiveincreasingyear,theindicatorisestimatedtoreach265.17U.S.dollarsandthereforeanewpeakin2028.Notably,theaverageadspendingperinternetuserofthe'SocialMediaAdvertising'segmentofthedigital[...]
ReadmoreNote(s):UnitedStates;2019to2028Source(s):DigitalMarketInsightsSocialmediaadvertisingaveragespendingperinternetuserintheUnitedStatesfrom2019to2028,bydevice(inU.S.dollars)DigitalMarketOutlook:SMadspendperinternetuserU.S.2019-2028,bydeviceSocialMediaAdvertisingMobileSocialMediaAdvertisingDesktop3002502001501005036.0235.2734.53219.6202633.7632.86208.48202431.7130.1186.76202230.21178.67202126.525.58229.152028224.382027214.582025200.052023138.84106.7502019202012Description:Overthelasttwoobservations,theaverageadspendingperinternetuserisforecasttosignificantlyincreaseinallsegments.Aspartofthepositivetrend,theindicatorreachesthemaximumvalueforalltwodifferentsegmentsattheendofthecomparisonperiod.ParticularlynoteworthyisthesegmentSocialMediaAdvertisingMobile,whichhasthehighestvalueof229.15U.S.dollars.ReadmoreNote(s):UnitedStates;2019to2028Source(s):DigitalMarketInsightsCHAPTER
03CountrycomparisonsLeadingdigitaladvertisingmarketsworldwidein2022,byspending(inbillionU.S.dollars)DigitalMarketOutlook:largestdigitaladmarketsworldwide2022300243.8925020015010050155.6737.823.93Japan15.3513.6411.769.979.128.370UnitedStatesChinaUnitedKingdomGermanyCanadaAustraliaFranceSouthKoreaBrazil14Description:TheadspendingrankinginthedigitaladvertisingmarketisleadbytheUnitedStateswith243.89billionU.S.dollars,whileChinaisfollowingwith155.67billionU.S.dollars.Incontrast,Brazilisatthebottomoftherankingwith8.37billionU.S.dollars,showingadifferenceof235.52billionU.S.dollarstotheUnitedStates.ReadmoreNote(s):Worldwide;Jan1sttoDec31st2022Source(s):DigitalMarketInsightsLeadingmarketsworldwidein2022,bysocialmediaadvertisingspending(inmillionU.S.dollars)Largestsocialmediaadvertisingmarketsworldwide2022SpendinginmillionU.S.dollars30,000
40,000010,00020,00050,00060,00070,000UnitedStatesChina66,647.5564,630.08UnitedKingdomJapan9,045.47,026.05AustraliaGermanyCanada3,514.363,494.583,230.882,771.292,514.122,108.011,933.831,663.731,604.95FranceSouthKoreaBrazilItalyMexicoSpain15Description:Comparingthe20selectedregionsregardingtheadspendinginthe'SocialMediaAdvertising'segmentofthedigitaladvertisingmarket,theUnitedStatesisleadingtheranking(66.6billionU.S.dollars)andisfollowedbyChinawith64.6billionU.S.dollars.AttheotherendofthespectrumisThailandwith457.91mil
温馨提示
- 1. 本站所有资源如无特殊说明,都需要本地电脑安装OFFICE2007和PDF阅读器。图纸软件为CAD,CAXA,PROE,UG,SolidWorks等.压缩文件请下载最新的WinRAR软件解压。
- 2. 本站的文档不包含任何第三方提供的附件图纸等,如果需要附件,请联系上传者。文件的所有权益归上传用户所有。
- 3. 本站RAR压缩包中若带图纸,网页内容里面会有图纸预览,若没有图纸预览就没有图纸。
- 4. 未经权益所有人同意不得将文件中的内容挪作商业或盈利用途。
- 5. 人人文库网仅提供信息存储空间,仅对用户上传内容的表现方式做保护处理,对用户上传分享的文档内容本身不做任何修改或编辑,并不能对任何下载内容负责。
- 6. 下载文件中如有侵权或不适当内容,请与我们联系,我们立即纠正。
- 7. 本站不保证下载资源的准确性、安全性和完整性, 同时也不承担用户因使用这些下载资源对自己和他人造成任何形式的伤害或损失。
最新文档
- 大数据在智慧城市能源管理中的应用
- 学生心理素质教育的实践与创新方法
- 2025年中国心孔平边筛市场调查研究报告
- 2025年中国往复式恒温振荡水浴槽市场调查研究报告
- 2025年中国强肝胶囊市场调查研究报告
- 大数据助力实现健康中国战略
- 2025年中国带玻璃窗教室门市场调查研究报告
- 基于云服务的学校远程教育策略
- 如何处理孩子的叛逆期问题
- 2025年中国密封箱式软氮化炉数据监测报告
- 烫伤不良事件警示教育
- 河南省驻马店市泌阳县部分中学联考2024-2025学年八年级下学期3月月考数学试题(原卷版+解析版)
- 2025年湖北幼儿师范高等专科学校单招职业技能测试题库汇编
- 2025年浙江义乌市商城集团招聘笔试参考题库含答案解析
- DZ∕T 0222-2006 地质灾害防治工程监理规范(正式版)
- 愚公移山英文 -中国故事英文版课件
- 枫香精油(征求意见稿)
- 高压配电设备技术标(范本)要点
- 智能垃圾桶设计方案55264
- 2022年北京市专升本英语真题
- 老年泌尿系统疾病
评论
0/150
提交评论