


版权说明:本文档由用户提供并上传,收益归属内容提供方,若内容存在侵权,请进行举报或认领
文档简介
1、GlobalResearch27 June 2019Initiation of CoverageEquitiesChina Property ManagementEquitiesReal EstateChinaPotential to become integrated service providersReal EstateChinaOpportunity to become integrated service providersWeinitiatecoverageoftheChinaPropertyManagementssectorwithapositiveview. We like i
2、ts secular growth, light-asset business model, low policy risk, and the consolidationatbothmanagersanddeveloperslevels,leadingto26%2018-21EEPS CAGRforourcoverage.ComparisonwithglobalpeersimpliesChinesemanagersmay haveanopportunitytobecomeintegratedserviceproviders,whichwethinkisnotyet priced in. Her
3、e, we compare global peers business models, analyse project age to gaugethefuturemargintrend,andprojectdensityatcityleveltogaugetheprobability of developing the value-added services. Our top pick is A-Living due to attractive valuationsoncleanearningsbasisafterstrippingoffitsagencybusiness(connected
4、- partytransactions)andM&A(whichinvestorsdonotlike).Ourleast-preferredstockis ChinaOverseasPropertyHoldings(COPH),asweexpectdownsiderisktoconsensus earningsestimates.WeexpectthecatalystsaretheH119positiveprofitalertsinJuly.Will the management company be hurt by a margin squeeze?We think the margin w
5、ill remain stable at least for the next three years (2019-21), as the addition of new projects, where the margin is higher, offsets the falling margin of theexistingprojects,duetostrongGFAgrowth(27%CAGRin2018-21E).Ourproject age analysis suggests Greentown Service, COPH, and Colour Life have less ma
6、rgin downside risk as their projects are older.Lessons learned from global peersWethinkpropertymanagementcompanieshaveanedgeinprovidingproperty-related services(e.g.brokerage,decoration)astheyhaveinformationadvantagesandphysical access to property owners. For their global peers in property managemen
7、t sector, management fee revenue means about 50% of total revenue for residential-focused peers, e.g. FirstService, but less than 30% of total revenue for commercial-focused peers,e.g.CBREandJLL.Servicequalityandprojectdensityatcitylevelareimportant todrivingthevalue-addedservices.WeseeGreentownServ
8、icehasbothelements.Valuation: sector trading at 23.4x 12-month forward PEOur covered universe is trading at 23.4x 12-month forward PE with about 26% EPS CAGR in 2018-21E. We think the market has priced in the organic EPS growth, but probably not the potential upside from becoming an integrated servi
9、ce provider.Figure 1: China property management sector coverage universe and preferencesJohn Lam,CFAAnalyst HYPERLINK mailto:john-za.lam john-za.lam+852-2971 6358MarkLeungAnalyst HYPERLINK mailto:mark.leung +852-2971 8636MichaelXuAnalyst HYPERLINK mailto:michael-a.xu michael-a.xu+852-2971 5573Cindy
10、ChenAssociateAnalyst HYPERLINK mailto:cindy-zb.chen cindy-zb.chen+852-2971 8396Alex Kramm,CFAAnalyst HYPERLINK mailto:alex.kramm +1-212-7134060John AssociateAnalyst HYPERLINK mailto:john.goode john.goode+1-212-7139413CompanyStock codeMarket cap (US$ bn)3MADTV(US$ RatingStockprice(HK$)PT (HK$)Upside
11、%19E PE20E PE2018-21E EPS CAGRMostA-Living3319.HK2.34.1Buy13.3815.6017%15.111.527%preferredGreentown Service2869.HK2.34.3Buy6.408.0025%28.921.428%Colour Life1778.HK0.92.2Buy5.396.3017%10.59.017%LeastCG Services6098.HK5.712.7Neutral17.9618.704%34.126.428%preferredCOPH2669.HK1.84.3Sell4.272.70-37%29.2
12、23.522%Weighted Average5%27.521.326%Note: Price data as of 25 June 2019. Source: UBS estimates HYPERLINK /investmentresearch /investmentresearchThis report has been prepared by UBS Securities Asia Limited. ANALYST CERTIFICATION AND REQUIRED DISCLOSURES BEGIN ON PAGE 91. UBS does and seeks to do busi
13、ness with companies covered in its research reports. As a result, investors should be aware that the firm may have a conflict of interest that could affect the objectivity of this report. Investors should consider this report as only a single factor in making their investmentdecision.ContentsOURTHES
14、ISINPICTURES4STOCKPICKS6PIVOTALQUESTIONS10 HYPERLINK l _TOC_250007 Q: Will rising labour costs (accounts for about 60% of COGS) result in marginpressure? HYPERLINK l _TOC_250006 Q: Will global model of integrated service provider be adopted in China to drivegrowth?WHATSPRICEDIN?21CHINA PROPERTYMANAG
15、EMENTPRIMER23 HYPERLINK l _TOC_250005 Companypages30 HYPERLINK l _TOC_250004 CountryGardenServices HYPERLINK l _TOC_250003 GreentownServiceGroup HYPERLINK l _TOC_250002 A-LivingServices HYPERLINK l _TOC_250001 China OverseasPropertyHoldings HYPERLINK l _TOC_250000 ColourLifeServicesJohn Lam,CFAAnaly
16、st HYPERLINK mailto:john-za.lam john-za.lam+852-2971 6358MarkLeungAnalyst HYPERLINK mailto:mark.leung +852-2971 8636MichaelXuAnalyst HYPERLINK mailto:michael-a.xu michael-a.xu+852-2971 5573Cindy ChenAssociateAnalyst HYPERLINK mailto:cindy-zb.chen cindy-zb.chen+852-2971 8396Alex Kramm,CFAAnalyst HYPE
17、RLINK mailto:alex.kramm +1-212-7134060John AssociateAnalyst HYPERLINK mailto:john.goode john.goode+1-212-7139413China Property ManagementUBS Research THESIS MAP a guide to our thinking and whats where inthis reportOURTHESISINPICTURESMOSTFAVOUREDLEAST FAVOUREDA-LivingCOPHPIVOTALQUESTIONSQ: Will risin
18、g labour costs (accounts for about 60% of COGS) result in margin pressure?Not in the next three years, due to strong GFA growth from new projects. We think the margin of existingprojectsisfallingasitisdifficultformanagementcompaniestoraisefees(asitrequiresmore than 50% of property owners to approve)
19、, but labour cost has been rising by 5-8% per annum. However,thenewprojectsmarginismuchhigherthanexistingprojectsduetohighermanagement fees and lower occupancy rate (i.e. lower maintenance cost). With strong GFA growth from new projects addition, we think the margin will remain stable in the next th
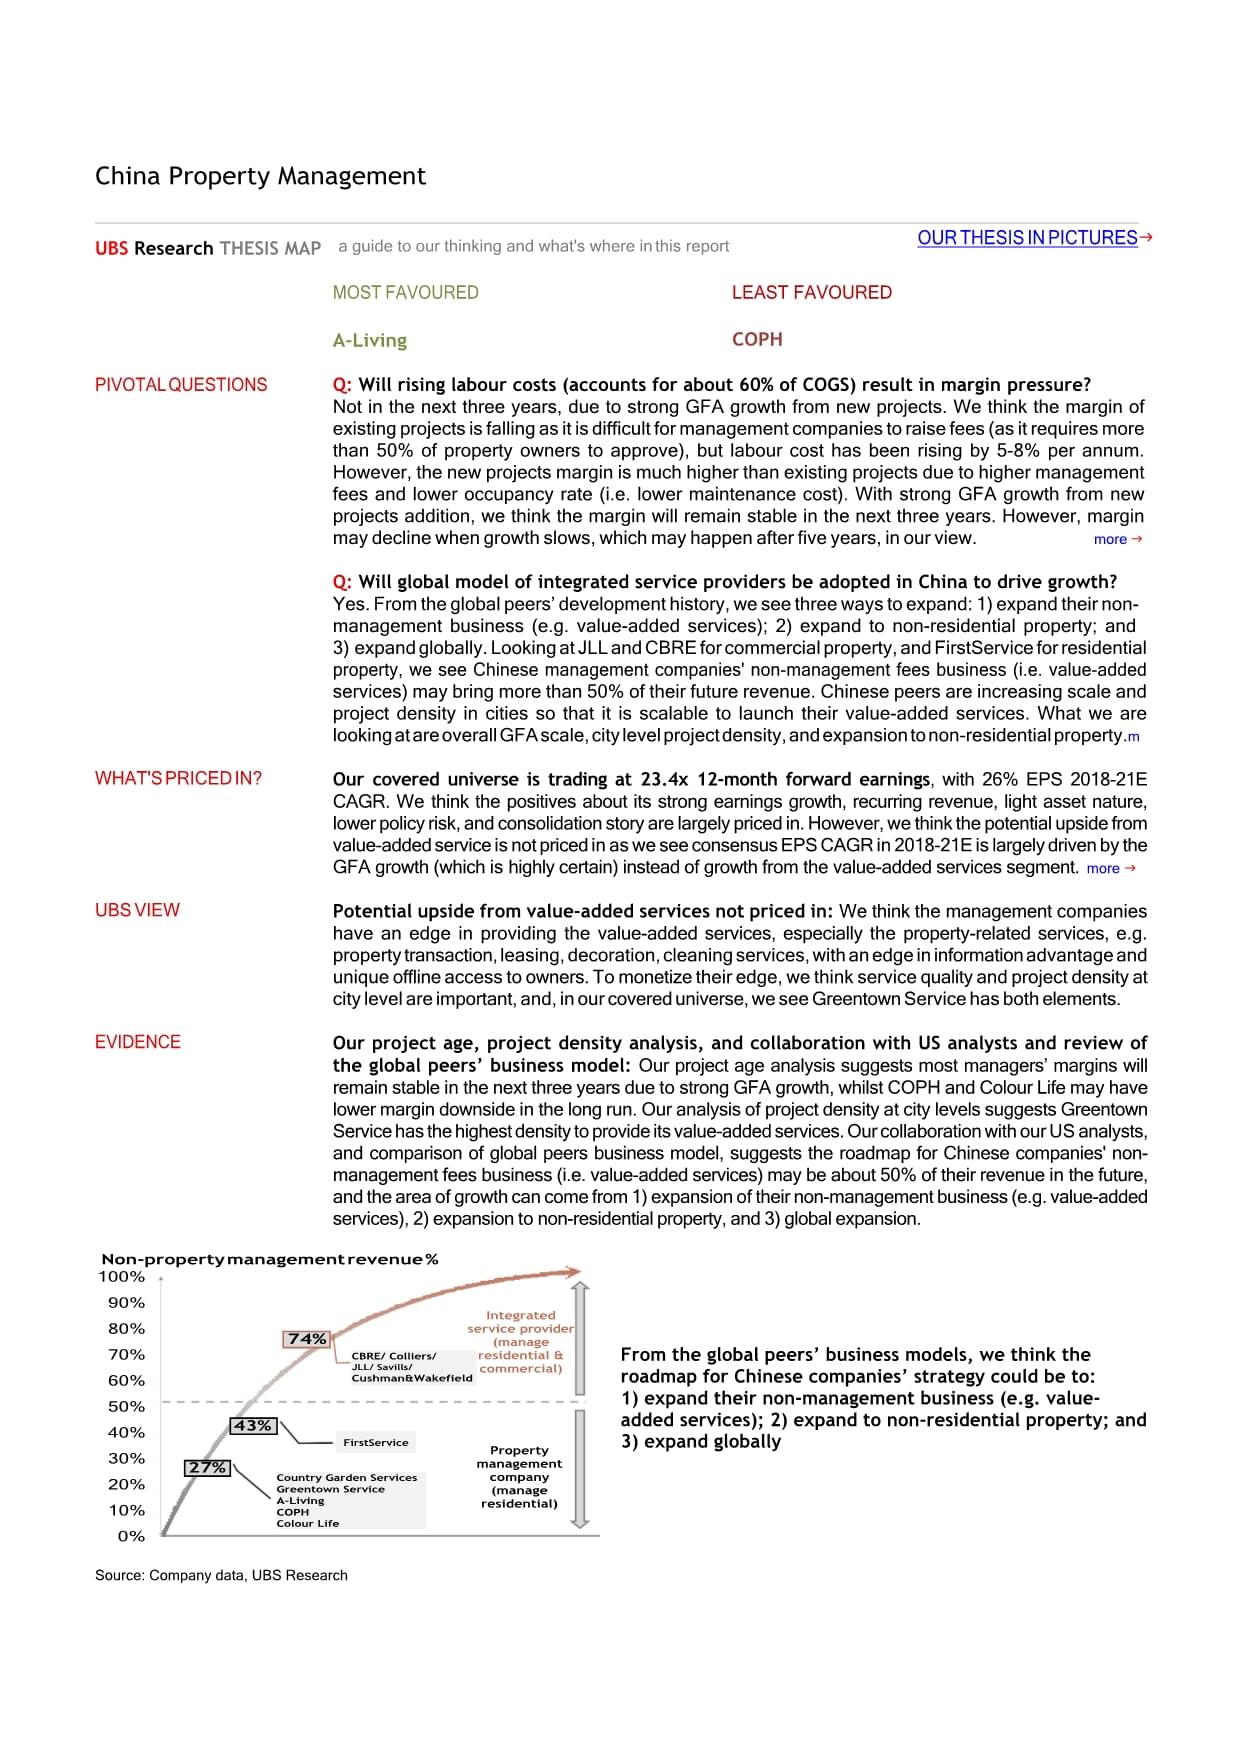
20、ree years. However, margin maydeclinewhengrowthslows,whichmayhappenafterfiveyears,inourview.moreQ: Will global model of integrated service providers be adopted in China to drive growth? Yes.Fromtheglobalpeersdevelopmenthistory,weseethreewaystoexpand:1)expandtheirnon- management business (e.g. value-
21、added services); 2) expand to non-residential property; and3)expandglobally.LookingatJLLandCBREforcommercialproperty,andFirstServiceforresidential property, we see Chinese management companies non-management fees business (i.e. value-added services)maybringmorethan50%oftheirfuturerevenue.Chinesepeer
22、sareincreasingscaleand project density in cities so that it is scalable to launch their value-added services. What we are lookingatareoverallGFAscale,citylevelprojectdensity,andexpansiontonon-residentialproperty.mWHATSPRICEDIN?We weisinasweinisbyis more UBSVIEWPotentialupsidefromvalue-addedservicesn
23、otpricedin:Wethecompanies have an edge in providing the the e.g. propertyleasing,decoration,cleaningservices,withanedgeinadvantageand uniqueaccesstoTotheiredge,wethinkserviceandprojectcitylevelareand,inourweseeServicehasbothEVIDENCEOur project age, project density analysis, and collaboration with US
24、 analysts and review of the global peers business model: intoinofatUSinofoftoIntegrated service (manage residential & commercial)Property management company (manage residential)Country Garden Services Greentown ServiceA-Living COPHColour Life27%FirstService43%CBRE/ Colliers/Cushman&Wakefield74%Non-p
25、ropertyIntegrated service (manage residential & commercial)Property management company (manage residential)Country Garden Services Greentown ServiceA-Living COPHColour Life27%FirstService43%CBRE/ Colliers/Cushman&Wakefield74%100%90%80%70%60%50%40%30%20%10%From the global peers business models, we th
26、ink the roadmap for Chinese companies strategy could be to:1) expand their non-management business (e.g. value- added services); 2) expand to non-residential property; and3) expand globallySource: Company data, UBS ResearchChina Property ManagementUBSResearchOURTHESISINPICTURESreturn 40%35%30%25%20%
27、15%10%5%0%10propertymanagementcompanies marketshare10.2% 11.1% 11.4%7.6%2.9%4.9%6.2%Top10propertydevelopers marketshareis30%in201810.2% 11.1% 11.4%7.6%2.9%4.9%6.2%2012201320142015201620172018We see strong consolidation potential as the market share of the top 10 property management companies (PMC) i
28、s only 11.4% (in terms of GFA under management), compared with a 30% market share for the top 10 developers. FirstService, the largest US residential property management company, has a 6% market share in USWeexpect27%CAGRGFAin2018-21Eforourcovered management companies due to project delivery of pare
29、nt developers and expansion into third-party developersareaNote: The CAGR shown in the chart above represents 2018-21E CAGR.% of new projects (3 years) vs 2018 GP margin% of new31%26%15%11%9%66%53%42%41%62%80%31%26%15%11%9%66%53%42%41%62%60%40%20%0%ivingCGSGreentown Service2018 GPM35%30%25%20%15%10%
30、Colour LifeCOPHCompanies with more newly completed projects tend to havehighermargins,i.e.theirmarginmaybesubjectto more downside risk when their GFA growth slows(Note:GPmarginistakenforGPMforpropertymanagementonly,and alsowehaveexcludedbothrevenueandgrossprofitcontributionfrom commissionbasis,i.e.,
31、weonlycomparetheGPMforlump-sumbasis,so thattheGPMwillbecomparable.)% of new projects (3 years)2018 GP margin*35030025020015010050-Numberofprojectsofcitywhichtheyhavehighest numberofprojectsintheirportfolio33019214010073HangzhouShanghaiGreentown Colour Life ServiceLanzhouA-LivingFoshanCGS330192140100
32、73HangzhouShanghaiGreentown Colour Life ServiceLanzhouA-LivingFoshanCGSBeijingCOPH(Rmb/sqm)1.12018 revenue from VAS to property owners / revenue -bearing GFA86Greentown Service has the highest value-addedservice4revenue per unit ofGFA20Greentown ServiceA-LivingGarden China Overseas Property
33、Colour LifeSector weighted average - 12MTH FORWARD PE+1 SD: 23.9xAvg: 21.3x-1 SD: 18.7x30Sector weighted average - 12MTH FORWARD PE+1 SD: 23.9xAvg: 21.3x-1 SD: 18.7x282624Thesectoristradingat23.4xon12-monthforwardPE222018Jul-18 Aug-18 Aug-18 Sep-18 Sep-18 Oct-18 Oct-18 Oct-18 Nov-18 Nov-18 Dec-18 De
34、c-18 Jan-19 Jan-19 Feb-19 Feb-19 Mar-19 Mar-19 Apr-19 Apr-19 Apr-19 May-19 May-19Jul-18 Aug-18 Aug-18 Sep-18 Sep-18 Oct-18 Oct-18 Oct-18 Nov-18 Nov-18 Dec-18 Dec-18 Jan-19 Jan-19 Feb-19 Feb-19 Mar-19 Mar-19 Apr-19 Apr-19 Apr-19 May-19 May-19Jun-19 12M fwd P/E Historical average sinceJuly2018+1SD-1 S
35、DSources for the exhibits above: China Index Academy, Company data, Thomson Reuters, UBS estimatesChina Property ManagementUBSResearchSTOCKPICKSreturn Conclusion: Our top pick is A-Living, due to attractive valuations on clean earningsbasisafterstrippingoffitsagencybusiness(connected-partytransactio
36、ns) and M&A (which investors do not like). We also like Greentown Service, which is rated at Buy, due to its strong earnings quality and high potential to develop its value-added services (VAS). We have a Neutral rating on CGS given its highest multiples among our coverage and limited potential to d
37、evelop VAS with itsfocus on lower-tier cities. We have a Sell rating on COPH as we think it is over-valued, and has potential earnings downside risk. We have a Buy rating on Colour Life, mainly on valuation.Figure 2: Summary of our stock view: our top pick is A-Living; least preferred is COPHStockSt
38、ockcode RatingPT (HK$)price (HK$)Upside% Our viewA-LivingisA-Livingisourtoppick.WeunderstandthemarketisconcernedwithA-Livingsagencybusiness(due toconnectedpartytransaction)and(whichinvestorsdonotlike).However,evenstrippingoutA-Living3319.HK Buy15.613.38 17% bothbusiness,weestimateA-Living2019/20Eear
39、ningswillbereducedby32%/34%,respectively,andcorresponding2019/20PEwillbecome22.3x/17.3x,whichremainsattractivevsCGS,Greentown Service and COPH.GreentownService2869.HK Buy8.06.40 Colour Life 1778.HK Buy6.35.39 GreentownServicehasthehighestpotentialindevelopingaprofitableandsustainablevalueadded servi
40、ces business due to highest project density, which is not pricedin.Thestocktradesat21.4x2020Ewith28%2018-21EEPSCAGR.Inourview,thisismore attractive than CGS and COPH valuation of 26.4x/23.5x 2020 with 28%/22% EPS CAGR respectivelyTrading at 9.0 x 2020E with 17% 2018-21E EPS CAGR, we think the negati
41、ves about its aggressiveinthepast(whichinvestorsdonotlike)ispricedin.Also,ColourLifeisgoingtoslow down its acquisition, we think it may help its cash flow and valuationmultipleWelikeColourLifeshighcitylevelprojectdensityandolderprojectvintagethanpeers,which suggestsmorepotentialforitsvalueaddedservi
42、cesdevelopmentandlessmargindownsiderisk.CGS6098.HK Neutral18.717.964%1)34.1x/26.4x2019/20ECGStradesatthehighestmultiplesamongourcoverage,suggestingits earnings growth have been priced in.2)WeseelimitedpotentialforCGStodevelopvalueaddedservicesgivenitsfocusonlower-tiercities.1)Withsharepriceupby86%YT
43、D(vsourcovereduniverseof+32%),thestocknowtradesat23.5x2020Ewith22%of2018-21EEPSCAGR.WeseethepositiveonthedevelopmentofvalueaddedLeast preferredCOPH2669.HKSell2.74.27-37%services is largely priced in.2)However,wethinkthemarginpressuremaynotbepricedin,givencompanysfocustoimproveitsservice quality. In
44、2018, COPHs GP margin has declined from 21% to 18%.Source: Company data, UBS estimatesScorecard on managers. Greentown Service scores highest, followed by CGS: Since the sector is still growing, we think the investment thesis is about the managers earnings growth and earnings quality. We also added
45、corporate governance and liquidity in our scorecard. Our target 2020E PE is based on the scoreofthefollowingmetrics.Weuse2020EPEinsteadof2019EPEasourtarget PE as our price target is on 12 months, and we expect investors will roll over the earningsinto2020whenthosecompaniesreportH119resultsinAugust20
46、19.Growth visibility (40% of weighting): We include the reserve area as a proportion of the revenue-bearing area, and also the contract sales for their related developers to gauge their future growth visibility, each with 20% weighting.Earnings quality (40% of weighting): We use five metrics, each w
47、ith an 8% weighting.Connected party transaction percentage of revenue: The lower thebetter,asthissuggestmoresustainableearningsinfuture.Percentage of contracted GFA from M&A: The lower the better. The stock market has been penalizing managers from acquiring the GFA through M&A as the management cont
48、ract usually lasts for three to five years for residential property, while the PE valuationfor M&A is about 10 x.Percentage of contracted GFA from third-party developer: The higher the better, as this tells the managers capability to win a contract in an open market.Project age: The higher the bette
49、r. The lower score suggests the managers projects are newer, i.e. their current reported margin would be subject to more downside as those projects will become olderinfuture(seep.10inPQ1fordiscussionofprojectage).Projectdensity:Thehigherthebetter,asthehigherprojectdensity atcitylevelhelpsthemanagers
50、toexpandtheirthird-partydeveloper areaaswellaslaunchingtheirvalue-addedservices.Corporate governance (10%): The higher the better. Since the managers are related to developers, we are concerned whether the developers willuse the managers as a funding channel due to higher valuation multiples and str
51、onger cash flow for the managers.Stock liquidity (10%): The higher the better, as some managers stock liquiditymaybetoothinforinvestors.Weuse2019Eearningstogaugethat.ScorecardGrowth visibility (40%)ScorecardGrowth visibility (40%)Earnings quality (40%)Corporate governance (10%)Liquidity (10%)Target2
52、018 reserve2018 connected2018 % ofcontracted2018 % ofcontracted GFA from 3rd party2019E net2020Earea % of rev.Developers2018 contractparty transactionGFA fromdevelopers (ex.ProjectProjectprofit (RmbCompanyP/EScorebearing arearelatedsales (Rmb bn)as % of revenueM&AM&A)vintagedensitym)Greentown Servic
53、e28.03.6113%Greentown China1561%10%79%355542CGS28.03.6178%Country Garden72920%4%16%2311,251COPH*15.02.833%COLI25415%0%8%515480A-Living*14.02.597%Agile, Greenland20846%17%34%1221,038Colour Life11.02.552%Fantasia302%40%59%442600Note:*COPHsreserveareapercentageofrevenuebearingareaisbasedonUBSestimates;
54、percentageofGFAfromthird-partydevelopersisbasedonrevenue-bearing GFA; * for A-Living, 2018 contract sales include Agiles contract sales of Rmb102.7bn and Greenlands committed annual contribution of 10m sqm (ASP Rmb10.6k/sqm).Source: Company data, UBS estimatesFigure 4: Valuation comps for Chinese ma
55、nagers and global peersChinese peersStock codeMarket cap (US$ bn)3MADTV(US$m)RatingStock price (local crny)PT (local crny)Upside %P/EP/BDiv yield2019E2020E2021E2019E2020E2021E2019E2020E2021ECountryGardenServices6098.HK5.712.7Neutral17.9618.704%0.7%0.9%1.2%Greentown Service2869.HK2.34.3Buy
56、6.408.0025%28.9%1.6%2.2%A-Living3319.HK2.34.1Buy13.3815.6017%3.3%4.4%5.4%COPH2669.HK1.84.3Sell4.272.70-37%1.1%1.4%1.7%Colour Life1778.HK0.92.2Buy5.396.3017%10.59.01.43.5%4.1%4.7%Xinchengyue1755.HK0.91.8Not Rated8.51N/AN/A25.0%2.2%3.3%Ever Sunshine1995.HK0.71.2Not Rated
57、3.50N/AN/A23.3%1.9%N/AKaisa Property2168.HK0.20.5Not Rated12.92N/AN/A11.0%2.3%2.8%Nacity603506.SS0.4N/ANot Rated25.50N/AN/A1.2%1.2%1.2%Weighted Average5%26.9%1.9%2.5%Global peersStock codeMarket cap (US$ bn)3MADTV(US$m)RatingStock price (local crny)PT (local crny)Upside %P/EP/BDiv yield201
58、9E2020E2021E2019E2020E2021E2019E2020E2021EGlobal Real Estate BrokersCBRECBRE.K16.872.3Neutral50.0456.0012%13.6%0.0%0.0%JLLJLL6.247.2Neutral136.29173.0027%11.410.710.00.6%0.6%0.7%Cushman & WakefieldCWK3.818.6Buy17.4523.0032%0.0%0.0%0.0%ColliersCIGI.TO2.75.8Not Rated93.28N/AN/A20.018.5N/A45.
59、638.833.40.1%0.1%N/ASavillsSVS.L1.60.2Buy891.001,075.0021%12.3%3.5%3.5%Weighted Average18%0.3%0.3%0.4%Global Facility Service ProvidersCompass Group4CPG.L38.16.0Buy1,883.001,910.001%22.620.819.311.210.710.32.2%2.4%2.6%Sodexo5EXHO.PA17.20.0Neutral102.50104.001%19.5%3.0%
60、3.4%ServiceMasterSERV.K7.24.9Not Rated52.99N/AN/A37.622.019.00.0%0.0%0.0%Securitas6SECUb.ST6.20.0Sell165.35135.00-18%3.1%3.1%3.4%ISS A/S5ISS.CO5.60.0Buy197.35220.0011%3.9%3.9%3.9%G4S6GFS.L4.20.2Buy210.00235.0012%4.8%4.9%5.1%FirstServiceFSV.TO3.60.1Not Rated126.54N/AN/A41.336.7N/A61.852.745.30.5%0.5%
温馨提示
- 1. 本站所有资源如无特殊说明,都需要本地电脑安装OFFICE2007和PDF阅读器。图纸软件为CAD,CAXA,PROE,UG,SolidWorks等.压缩文件请下载最新的WinRAR软件解压。
- 2. 本站的文档不包含任何第三方提供的附件图纸等,如果需要附件,请联系上传者。文件的所有权益归上传用户所有。
- 3. 本站RAR压缩包中若带图纸,网页内容里面会有图纸预览,若没有图纸预览就没有图纸。
- 4. 未经权益所有人同意不得将文件中的内容挪作商业或盈利用途。
- 5. 人人文库网仅提供信息存储空间,仅对用户上传内容的表现方式做保护处理,对用户上传分享的文档内容本身不做任何修改或编辑,并不能对任何下载内容负责。
- 6. 下载文件中如有侵权或不适当内容,请与我们联系,我们立即纠正。
- 7. 本站不保证下载资源的准确性、安全性和完整性, 同时也不承担用户因使用这些下载资源对自己和他人造成任何形式的伤害或损失。
最新文档
- 煤矿机械制造市场前景分析与未来发展预测报告模板
- 污水处理及中水回用工程可行性研究报告书
- 责任护士职责
- 全球地下基础设备维护行业分析:市场收入约为64990百万美元
- 贵州省贵州省2024-2025学年高三上学期9月月考物理试题(无答案)
- 浙江省杭州市启正中学2024-2025学年九年级上学期英语开学考试题(原卷版)
- 抗日战争时期的政治概况和文化
- 精装修水电施工技术交底
- 第二单元测试卷-2024-2025学年语文三年级上册统编版
- 期中试卷(1~4单元) (试题)-2024-2025学年六年级上册数学人教版
- SH/T 3078-2024 立式圆筒形料仓工程设计规范(正式版)
- 慢性阻塞性肺疾病案例分析护理
- 板式换热器对数平均温差计算公式
- 航天禁(限)用工艺目录(2021版)-发文稿(公开)
- 产品选型方案设计
- 律师职业介绍
- 直播运营测试题附有答案
- 小鱼研究员:中国研学产业发展趋势报告2024
- 海洋低碳生态
- 组织内部沟通和协作
- 2024年西藏自治区专升本考试法学基础测试题含解析
评论
0/150
提交评论